Session Timing

True System Automation means you program your trading system to start and stop at designated times while you go play golf, right?

This means that in addition to having a Master Enable/Disable switch you need to automate the start and stop of your trading session. For example, you might want to start your session at 9:30 AM and have it automatically end at 4:00 PM.

The code below uses the ParamDate() and ParamTime() to set the session start and stop dates/times, and compares these parameters to the system Date and Time that are returned by the Now() function. It generates various session-states that are displayed in the Title, when you incorporate this code into your system you will use these states to perform specific actions, like Close all Positions, Cancel all Orders, etc. The BlinkText() is not really needed but was thrown in for fun.

function BlinkTextText )
{
ABAxisColor colorWhite;
if( Status("redrawaction") )
{
BlinkStateStaticVarGet("BlinkState");
if( IsNullBlinkState) ) StaticVarSet("BlinkState"False);
if( BlinkState )
{
Text EncodeColor(colorBrightGreen)+Text+EncodeColor(ABAxisColor);
StaticVarSet("BlinkState"False);
}
else
{
Text EncodeColor(ABAxisColor)+Text;
StaticVarSet("BlinkState"True);
}
}
return Text;
}
RequestTimedRefresh);
DisableSessionTiming ParamToggle("Auto Session Timing","ENABLED|DISABLED",1);
ParamDateNumber  ParamDate("Date"Now(1), 0);
ParamStartTime   ParamTime("Start","09:30:00");
ParamEndTime   ParamTime("End","15:59:00");
RTTimeNumber  Now(4);
RTDateNumber  Now(3);
InSessionDate  RTDateNumber == ParamDateNumber;
PreSessionTime  RTTimeNumber &ltParamStartTime;
PostSessionTime  RTTimeNumber &gtParamEndTime;
InSessionTime  NOT PreSessionTime OR PostSessionTime );
PrevInSession   StaticVarGet("InSession");
if( DisableSessionTiming )  InSession 1;
else     InSession InSessionDate AND InSessionTime;
StartSessionTrigger LastValue(InSession) &gtPrevInSession;
EndSessionTrigger LastValue(InSession) &ltPrevInSession;
StaticVarSet("InSession"InSession);
OutOfSessionColor  ParamColor("Out of Session",colorBlack);
PlotNOT InSession,"",colorBlack,styleArea|styleOwnScale|styleNoLabel,0,1);
Title "\n"+BlinkTextNow(0) )+"\n"+
"Session Status: "+
WriteIfDisableSessionTiming"Session Timing Disabled",
WriteIfNOT InSessionDate,"Out of Session date, ","")+
WriteIf(PreSessionTime AND InSessionDate,"Waiting for Start, ","")+
WriteIf(StartSessionTrigger"Start Trigger, ","")+
WriteIf(InSessionTime"In Progress, ","")+
WriteIf(EndSessionTrigger"End Trigger, ","")+
WriteIf(PostSessionTime"Completed",""));

Edited by Al Venosa

The Master AT switch

When you are using an Automated Trading system, you need a master switch to allow you to Enable/Disable all automated action. It is very important for this switch to be Off when you start AmiBroker because the last thing you want is to see is that orders are going out right after launching AmiBroker.

You cannot use the ParamToggle() because this function resumes the last state it was in before you closed AmiBroker, i.e. if it was Enabled when AmiBroker shut down, then it would be Enabled after startup. You need a function that always starts up Disabled, no matter under what condition AmiBroker closed.

To create a switch that is always Off at the time of startup, you use two ParamTrigger()s, one to turn On Automation and one to turn Off Automation.

AutoTrading nz(StaticVarGet("AutoTrading"));<p>ATonTrigger ParamTrigger("Start AutoTrading","START");<p>AToffTrigger ParamTrigger("Stop AutoTrading","STOP");<p>if( ATonTrigger )StaticVarSet("AutoTrading",1);<p>else if( AToffTrigger )StaticVarSet("AutoTrading",0);<p>AutoTrading StaticVarGet("AutoTrading");<p>Title "\nAutoTrading "+WriteIfAutoTrading"On","Off");<p>

Edited by Al Venosa

Pane and Window Execution order

Few users pay attention to the order in which tasks performed in the various Amibroker panes and Windows are executed. The order of pane-executions can have a major impact on the performance of a fast, Real-Time trading system. It is easy to assume that the pane-formulas execute top down, but they don’t. In fact, the order of execution is unpredictable and should, for all practical purposes, be considered Random by the user.

For example, when using Static or Persistent Variables, if you initialize a StaticVariable in the top pane for use in the lower pane, you want the top pane to execute first so that the newly assigned value can be used immediately, i.e., during the same refresh in the lower pane and not at the next Chart Refresh, which may happen a second or more later.

Now consider that the lower pane executes first. In this case, it would require waiting either until the next quote or, if you use the function RequestTimedRefresh(1), the next second (whichever comes first). In this case, the Static Variable would contain a value from the previous Refresh, which means the value of the Static Variable would lag by one Chart refresh. If the formula in the lower pane is placing orders with LMT prices based on the last quote (the one that triggered the refresh) and since the LMT price was calculated in the top pane during the previous Refresh, the LMT price used would be based on the previous and not the last quote. In most cases, this would decrease your probability of a LMT fill.

An obvious solution is both to append your ordering code to the code that initializes your Static variable and to execute in the same pane. However, this may be difficult to do if your formulas are long, or if each formula generates charts with different scales and/or incompatible Titles. Even so, if you decide to solve the problem this way, you should consider using #include files.

Another solution is to force a RefreshALL at the end of your initializing formula. This will refresh all panes without delay, but now some panes may be executed more than once for each Chart Refresh. You will have to decide if this is significant in your system. The following two lines can be appended to your code and will force a RefreshAll. Be aware that the minimum RefreshAll interval is one second, so if your quotes arrive faster, this may not work very well.

oAB = CreateObject("Broker.Application");
oAB.RefreshAll();

If order of execution is critical, you can make the RefreshAll() conditional on the count of a pane-counter and only force a RefreshAll if the pane execution order demands it. To find the pane execution order, you can add a pane execution counter to all pane formulas and log the count to DebugView. If the count is lower in, say, the upper pane compared to the lower, that means it was executed in the upper pane earlier. If the count is greater, it was executed later than the lower pane.

To be able to identify the formula being executed in your log, place the formula name at the very top of your formula:

Filename = StrLeft(_DEFAULT_NAME(),StrLen(_DEFAULT_NAME())-2);

To add the counter you append the following code to the very end of your formula:

PaneCounter = Nz(StaticVarGet("PaneCounter"));
StaticVarSet("PaneCounter",PaneCounter+1);
CounterDisplayLine = Filename +", ChartID: "+GetChartID()+", PaneCounter: "+NumToStr( PaneCounter,1.0,False);
_TRACE( "# "+CounterDisplayLine );

This will show the order and time of execution, in seconds, in the DebugView window:

snag-0770.jpg

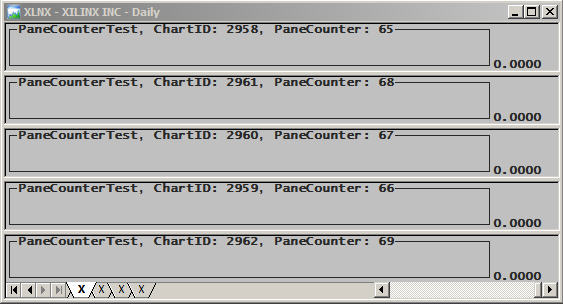
You can study/analyze pane execution order without disturbing your code by Inserting the 4-line code below multiple times in the same window, thus creating multiple panes. Then change the order of panes using the small arrows in the menu that pops up when you hover your mouse pointer over the top right corner of the pane. In this example the pane order is shown in the Chart Title.

Filename = StrLeft(_DEFAULT_NAME(),StrLen(_DEFAULT_NAME())-2);
PaneCounter = Nz(StaticVarGet("PaneCounter"));
StaticVarSet("PaneCounter",PaneCounter+1);
Title = Filename +", PaneCounter: "+NumToStr( PaneCounter,1.0,False);

snag-0771.jpg

The above capture shows that the execution order is not top down. You may observe that, in your case, the execution order tracks the ChartID. This is because the panes were inserted in sequence one after another, but this would not normally be the case.

While this topic may not be important to everyone, it will become critical when you start tinkering with High-Frequency trading systems.

Edited by Al Venosa

Price Bound Checking

When you start to design your own trading system, you will soon realize the need to custom define the BuyPrice, SellPrice, ShortPrice, and CoverPrice. Similarly, you may want to set your trade delays using the in-code function SetTradeDelays(d,d,d,d). Such hard-coded definitions will override the default trade prices and delays set in the Automatic Analysis (AA) Settings, and this will prevent you from inadvertently using the default settings. The problem is that defining your own price arrays increases the risk of introducing pricing errors, such as Price Bound Errors.

AmiBroker provides a function called SetOption(“PriceBoundChecking”,TRUE/FALSE) to Enable/Disable Price Bound Checking. Enabling this option will adjust prices so that they fall within the High-Low range and mask your pricing errors. The problem, of course, is that in practical trading these prices are impossible to trade, and your Backtests will not reflect realistic conditions. The best way to handle this is to turn Off Price Bound Checking and write your own error detection code. The code below checks your trade prices for Out of Bounds errors, displays the number of errors it finds, and plots a red marker (bar) at the bottom of your chart where the error occurs.

SetOption("PriceBoundChecking",False);
BuyError = ( BuyPrice > H OR BuyPrice < L ) AND Buy;
SellError = ( SellPrice > H OR SellPrice < L ) AND Sell;
ShortError = ( ShortPrice > H OR ShortPrice < L ) AND Short;
CoverError = ( CoverPrice > H OR CoverPrice < L ) AND Cover;
PricingErrors = BuyError OR SellError OR ShortError OR CoverError;
Plot(PricingErrors ,"Bound Errors",colorRed,styleArea|styleOwnScale,0,10);
Title = "# Price Bound Errors: "+NumToStr(Cum(PricingErrors),1.0,False)+"\n";

Edited by Al venosa

Using Zig() to reveal profit potential

Indicators like the Zig() can be used to reveal the profit potential for different stocks and in different time frames. Using this function is purely a fun experiment to give you a sense of where the profits are and what happens when you reduce trade duration. This function looks into the future and, of course, should never be used for trading with real money.

As shown below in the last line of the code, the Chart Title displays profit potential for combinations of trade duration and % change. Author’s note: while this is arguable, my interpretation is that shorter trade durations will give you smaller DDs, lower risk, and greater profits. The old argument of commission costs killing a High Frequency trading system no longer holds; commission costs may almost be ignored. For managing a high number of short term trades, using the IBc can allow 100 or more automated trades per day with no effort at all.

To run this code, copy it to an Indicator, click Insert, right-click on the chart to bring up the Param window, and vary the parameters to see for yourself where the profits occur. Try changing the ticker, commissions, the test period, etc. You may be surprised and decide you are trading the wrong Tickers.

Opt1 = Param("%Zig(Change)",0.1,0,1,0.05);
Opt2 = Param("Min.AllowableDuration",1,1,20,1);
Z = Zig(C,Opt1);
Buy = Z < Ref(Z,1) AND Z < Ref(Z,-1);
Sell = Z > Ref(Z,1) AND Z > Ref(Z,-1);
Buy = Buy AND BarsSince(Sell) > Opt2;
Sell = Sell AND BarsSince(Buy) > Opt2;
Short = Sell;
Cover = Buy;
Eq = Equity(1);
Plot(C,"",colorBlack,styleBar);
Plot(z,"",colorWhite,styleLine);
ShowTriangles = ParamToggle("Arrows","HIDE|SHOW",1);
if(showTriangles)
{
PlotShapes(IIf(Buy,shapeSmallUpTriangle,shapeNone),5,0,BuyPrice,0);
PlotShapes(IIf(Sell,shapeHollowDownTriangle,shapeNone),4,0,SellPrice,0);
PlotShapes(IIf(Cover,shapeHollowUpTriangle,shapeNone),5,0,CoverPrice,0);
PlotShapes(IIf(Short,shapeSmallDownTriangle,shapeNone),4,0,ShortPrice,0);
}
InitialEquity = GetOption("InitialEquity");
Title = "\n"+"\n"+"FinalProfit:"+NumToStr((LastValue(Eq)-InitialEquity)/InitialEquity*100,1.2)+"%\n";

Edited by Al Venosa

Analyzing Ticker Relationships

Note: There may be a problem with this code since the possibility of padded data occuring within the correlation period wasn’t considered. This code is under review right now. [Herman]

When experimenting with or looking for trading ideas, you may want to analyze the relationships or correlation between any two tickers. For example, you could be looking for lagging, leading, tracking, or contrarian qualities. You can do this very easily using the Automatic Analysis (AA) Explore function and the AFL Correlation() function.

The example below generates an X-Y table or correlation matrix showing the correlation between tickers selected in the AA Filter (Y-axis) and the tickers from the Watchlist selected in the AA Param window (X-axis). The resulting table looks like this:

snag-0762.jpg

For the X-Y axis to have the same order, you should sort your Watchlist alphabetically in your workspace (right-click on the Watchlist and click Sort Alphabetically). To run the exploration below, copy the code to the AA editor, set the AA Filter for your Watchlist, select your Watchlist in the AA Param window, and click Explore.

WLNum = Param("WatchList Number",0,0,64,1);
CorrPd = Param("Correlation Period",8,1,30,1);
list = GetCategorySymbols( categoryWatchlist, WLNum);
SetOption("NoDefaultColumns",True);
Filter = Status("LastBarInTest");
SetSortColumns( 1 );
AddTextColumn(Name(),"Correlation",1.0);
Ticker1= Name();
for( Col=0; (Ticker2=StrExtract( List, Col))!= ""; Col++)
{
Var2 = Foreign(Ticker2,"C");
Corr = Correlation( C, Var2, CorrPd);
Color = IIf(Corr>0, colorBrightGreen, IIf(Corr<0, colorRed,colorWhite));
Color = IIf(Ticker1==Ticker2, 1, Color);
AddColumn( Corr, Ticker2, 1.3, 1, Color);
}

Edited by Al Venosa

Persistent Variables (v3)

Static Variables retain their values as long as AmiBroker is running. If you shut down AmiBroker or experience a computer crash, your Static Variables lose their values. This can create serious problems in Automated Trading. For example, suppose you experience a computer crash while you have many pending orders. After restarting everything, you are unable to modify the orders, and so you are forced to use the TWS to manually clean up the mess and restart.

To prevent this situation, you can use Persistent variables that store their values on your Hard Disk. They will remain there until you delete them. Using Persistent variables, if you experience a crash or shut down your system during the night, the persistent variables will automatically be reloaded when you power up again.

Persistent variables can also be used to save ticker-specific system parameters. For example, you could run an optimization and save the optimized parameters in a Persistent Variable encoded with the Ticker’s name. Below are examples for saving text and numerical values. Arrays are not included here because arrays are better handled in other ways. Included in the code below is a handy function to create Persistent lists and to remove items from these lists. The list functions are useful when you wish to save lists of Symbols and/or OrderIDs dynamically.

Note that these parameters must be stored in a specific folder on your Hard Disk (see first code line below for an example of a typical recommended path). You must assign the desired location to the string variable PersistentPath. Remember that Persistent variables are Global just like Static variables, and their names may have to be encoded with ChartIDs and/or Symbol names to prevent them from being modified by different programs.

PersistentPath = "C:\\Program Files\\AmiBroker\\PersistentVariables\\";

function PersistentVarSetText( VarName, String )
{
global PersistentPath;
fh = fopen( PersistentPath+VarName+".pva","w" );
if( fh )
{
fputs( String, fh );
fclose( fh );
}
return fh;
}

function PersistentVarGetText( VarName )
{
global PersistentPath;
fh = fopen( PersistentPath+VarName+".pva","r" );
if( fh )
{
String = fgets( fh );
fclose( fh );
}
else string = "";
return String;
}

function PersistentVarSet( VarName, Number )
{
global PersistentPath;
String = NumToStr(Number);
fh = fopen( PersistentPath+VarName+".pva","w" );
if( fh )
{
fputs( String, fh );
fclose( fh );
}
return fh;
}


function PersistentVarGet( VarName )
{
global PersistentPath;
fh = fopen( PersistentPath+VarName+".pva","r" );
if( fh )
{
String = fgets( fh );
fclose( fh );
Number = StrToNum(String);
}
else Number = Null;
return Number;
}

function PersistentListAdd( VarName, String )
{
SubStrExists = 0;
if( String != "" )
{
List = PersistentVarGetText( VarName );
for( i=0; ( LoopItem = StrExtract( List, i ) ) != ""; i++ )
{
if( LoopItem == String ) SubStrExists = 1;
}
if( NOT SubStrExists )
{
List = List + String+",";
PersistentVarSetText( VarName, List );
}
}
Return List;
}

function PersistentListRemove( VarName, String )
{
if( String != "" )
{
List = PersistentVarGetText( VarName );
NewList = "";
for( i=0; ( LoopItem = StrExtract( List, i ) ) != ""; i++ )
{
if( LoopItem != String ) NewList = NewList + LoopItem +",";
}
PersistentVarSetText( VarName, NewList );
}
Return NewList;
}

function PersistentVarAddLineVarNameLine )
{
    global PersistentPath;
    fh 0;
    if ( Line != "" )
    {
        fh fopenPersistentPath VarName ".pva""a" );
        if ( fh )
        {
            fputsLine "\n"fh );
            fclosefh );
        }
    }
    return fh;
}

// Here is an example on how to export lines from an Exploration
// Look for the file in at the path defined at the top of this post
Filter Status"LastBarInTest" );
AddColumnC"C"1.2 );
ToFile Name() + "," NumToStrLastValue), 1.2 );
PersistentVarAddLine"MyData"ToFile );

The following function was kindly contributed by suresh (see comment) and can be used to delete Persistent variables:

function PersistentVarRemoveVarName )
{
global PersistentPath;
Fn=PersistentPath VarName ".pva";
fh=fdeleteFn ) ;
return fh;
}

Edited by Al Venosa

Setting up your TWS for Automatic Trading

This is a Quick-Start introduction to setting up your default settings in the TWS simulator and/or the actual TWS for automatic trading. Please refer to the official TWS documentation for more information on this and related topics.

For AmiBroker and the IBc to communicate with the TWS, you have to configure the TWS as follows:

Trader Workstation Configuration

In some of the later topics, you will learn about the TWS export file, which is read to obtain the actual prices at which your orders were filled. For this feature to work properly, you have to configure your TWS with the naming conventions shown below.

TWS Auto Export setup

The Export filenames are different for each IB account you use, and they are saved on your hard drive at the paths shown below:

Real.Trades. This filename is for your real-money trading account (C:\jts\Real.Trades).

Simulated.Trades. This filename is for your Simulated (Paper-Trader) account (C:\jts/Simulated.Trades).

Demo.Trades. This filename is for the eDemo account (C:\jts\Demo.Trades).

Be aware that exported trade lists are not date-stamped and will be overwritten the next day you trade.

Edited by Al Venosa

Plotting Trade-Prices

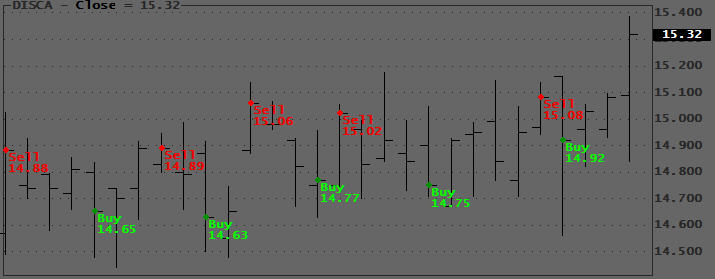
Instead of the traditional Arrows, which don’t really give you much useful information about your trade (such as filled prices), you can use PlotText() to plot exact Trade Prices, as in the example below:

Plot Price example

//Dummy system to generate some signals (Do NOT trade!)
Short = Cover = 0;
ZC = Zig(C,1);
Buy = T1 = Ref(ZC,1)>ZC;
Sell = T1 = Ref(ZC,1)<ZC;
BuyPrice = ZC;
SellPrice = ZC;
Equity(1);
// plotting prices at the correct level
Plot(C,"Close",colorBlack,styleBar);
PlotShapes( IIf(Buy, shapeSmallCircle, shapeNone),colorBrightGreen, 0, BuyPrice, 0 );
PlotShapes( IIf( Sell, shapeSmallCircle, shapeNone),colorRed, 0 ,SellPrice, 0 );
FirstVisibleBar = Status( "FirstVisibleBar" );
Lastvisiblebar = Status("LastVisibleBar");
for( b = Firstvisiblebar; b <= Lastvisiblebar AND b < BarCount; b++)
{
if( Buy[b] ) PlotText("\n Buy\n "+NumToStr(BuyPrice[b],1.2),b,BuyPrice[b],colorBrightGreen);
else if( Sell[b] ) PlotText("\n Sell\n "+NumToStr(SellPrice[b],1.2),b,SellPrice[b],colorRed);
}

Edited by Al Venosa

Removing Static Variables

Trading systems may use hundreds or even thousands of Static Variables, and the associated memory usage will eventually slow down your system. To prevent this you need to clear them whenever possible. Since at this time AmiBroker doesn’t have a function to remove all Static Variables from memory, you can remove them by referencing each of them by their name, i.e. StaticVarRemove( StaticVarName ).

Using an indexed name will allow you to use a loop to remove Static Variables from memory. For example, a naming convention such as BuyPrice+ NumToStr(n,1.0,false), where n could be the DateNum(), TimeNum(), DateTime(), BarIndex(), etc., would allow you to use a simple loop to generate all possible names and remove those that return non-null values.

Below are two examples of how to remove StaticVariables with this technique. Be careful when using BarNum() because the bar number changes if you use SetBarsRequired(), or if you use Quick-AFL, or if your data exceed the amount set in your DataBase settings or in Preferences.

procedure ClearAllTrades()
{
for( T=0; T<=BarCount; T++)
{
TradeNumStr = NumToStr(T,1.0,False);
TradeName = "Trade"+TradeNumStr;
StaticVarRemove( TradeName );
}
}

Here is an example of how to remove from memory Ticker-specific OrderIDs that were, for example, used in a portfolio trading system:

procedure RemoveBasketIDs()
{
global TradingBasket;
for( NT=0; ( Ticker = StrExtract( TradingBasket, NT ) ) != ""; NT++ )
{
StaticVarRemove(Ticker+"-OID");
StaticVarRemove(Ticker+"-Action");
StaticVarRemove(Ticker+"-Qty");
}
}

Edited by Al Venosa

Next Page »