June 26, 2007
Data Holes in Real-Time Trading
When AmiBroker doesn?t receive data during regular trading hours, the missing period or bar is referred to as a Hole in the data array. Holes can occur when a ticker isn?t trading or when the data feed is interrupted. They can last for any length of time and can occur in any timeframe.
When a bar has no data, the bar is not added to the database. The database record simply skips to the next bar-period. Holes may be filled in during backfill or when the data provider transmits data corrections. When this happens, the database is updated.
When plotting Indicators based on the selected current symbol, holes are skipped to create continuous looking charts. Because of this you cannot visually detect any holes. However, as will be explained below, this is not the case when plotting foreign data.
While AmiBroker never modifies the data it collects and stores in your database, it may fill in and fix holes during operations that require a common time base. Such operations would include several AA functions, the creation of composites, and chart overlays. The process of fixing and padding data to allow these operations is called data alignment.
Data Alignment in the AA
In Automatic Analyzer (AA) operations, data Alignment can be turned On/Off and the Reference Symbol to be used for alignment can be specified. This is explained in the AFL Function Reference quoted below:
?Pad and align to reference symbol
When this is turned on, all symbols’ quotes are padded and aligned to reference symbol. Note: by default this setting is OFF. Use responsibly. It may slow down backtest/exploration/scan and introduce some slight changes to indicator values when your data has holes and holes are filled with previous bar data. The feature is intended to be used when your system uses general market timing (generates global signals based on data and/or indicators calculated using Foreign from ‘reference’ symbol) or when you are creating composites out of unaligned data. Note: if reference symbol does not exist, data won’t be padded.?
Data alignment in Indicators
Foreign data used in Indicator formulas are aligned to the current symbol and not, as is the case in the AA, to the Reference symbol specified in the AA Settings. Depending on the value of the fixup parameter of the Foreign() function, data holes can be handled in any of three ways. This is explained in the AFL Function Reference as follows:
?The last parameter – fixup – accepts following values
- 0 – the holes are not fixed
- 1 – default value – missing data bar OHLC fields are filled using previous bar Close, and volume is set to zero.
- 2 – (old pre-4.90 behaviour) – causes filling the holes in the data with previous O, H, L, C, V values
The fixup parameter of 2 is provided to maintain compatibility with earlier AmiBroker releases and should not be used when developing new code.?
Holes in Real-Time Portfolio-Trading
When executing an RT portfolio trading system from an Indicator window, you typically loop through the portfolio tickers and use the Foreign() function to access data for each ticker as it is selected. Since both the current and the foreign tickers may have holes, there are a variety of hole conditions to deal with. Holes and padded bars may appear and disappear from your chart depending on the value of the fixup parameter and whether the current or foreign ticker has holes. Charts may also change during RT backfills. Since the plotted data are the same data used in your formulas, you have to be cautious about how you use foreign data.
The criteria to detect holes are simple: if the Volume equals null, the data are missing (hole); if the Volume equals zero, the data are padded (filled hole); and if the Volume is greater than zero, the data are true (no hole).
Since foreign data are aligned to the current ticker in Indicators, it can be stated that:
? If the current ticker has no data for a particular bar, the corresponding bar-interval for the foreign array will not be displayed and will not be available for calculations. This blocks foreign data and could result in missed signals.
? If the foreign ticker has no data for a particular bar while the corresponding bar for the current ticker has data, a bar will be added to the foreign array. If fixup is turned On, this bar will be filled with prices from the previous foreign bar. If you use Intraday signals, this could result in extra or duplicate signals.
It is obvious from the above that to design a robust High-Frequency Real-time portfolio trading system that executes in the Indicator window, you must consider the effect of holes on your signals.
Detecting Holes
To detect all holes perfectly, you need a perfect reference ticker, i.e., one that trades every minute of the day for every trading day of the year. If such a perfect ticker existed, you would make this your current ticker so that all foreign data would be aligned to it. Simply checking for zero volume would identify all holes. However, since such a perfect ticker does not exist in reality, if you assume that a ticker is perfect, you are simply transferring the hole problem from one ticker to another, and you wouldn’t be any closer to solving the problem.
A perfect solution would be to use a linear Date Reference Array that has bars for all calendar days. Such an array is documented in the post titled ?Date Calculations? on this site. To apply a linear Date Reference Array to detect holes is beyond the scope of this post, but it may be covered in a later post.
Another reasonably good solution is to use a high volume ticker, like the QQQQ, for your current ticker. The problem is that even the QQQQ has low volume periods and may contain holes.
A slightly better solution is to create a Volume composite for a group of actively traded tickers, perhaps from different markets, and make it your current symbol. For this composite to have a Hole there would have to be a period during which none of the tickers traded. While this is unlikely to happen in longer time frames, it can still happen in very short time frames, making this solution imperfect also. This solution will be used here to create a chart that displays (maps) the existence of holes for an entire WatchList all at once.
The demo code below uses a separate WatchList for the composite and the tickers to be mapped. To prevent a slow response (perceived as lockup by many) when large numbers of tickers are mapped, or when you inadvertently select a very large WatchList, you can set a maximum number of tickers (defaults to 50). You should only use high volume tickers for the composite WatchList since lightly traded tickers are unlikely to add any bars to the composite.
Program Parameters
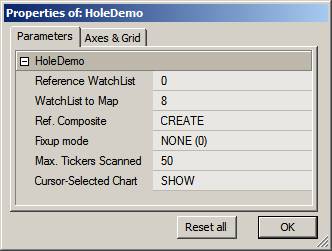
The Param window for the demo code has the following options:

The Reference Watchlist (0-based) should point to the group of tickers used to create the composite. You should always click UPDATE after changing the Reference Watchlist to create a new composite for the new Watchlist.
The Watchlist to Map selects the watchlist to be tested for holes. Each ticker in this watchlist will add a horizontal line to the chart. This would normally be your portfolio watchlist. Holes are indicated using a digit surrounded by a small circle. The digit is the fixup parameter used in the Foreign() to retrieve that data.
The occurrence of any digit shows the location of a hole. A 0 digit means the bar is Null or Empty, and no bar will show; a digit of 1 means that the bar was padded with only the C price from the previous bar; a digit of 2 means the data was padded with OHLCV (obsolete method!) data from the previous bar.
You can observe how holes are replaced with data from the previous bar. An empty bar is replaced with a bar identical to the preceding bar when you vary the fixup parameter in the Param window.
To demonstrate how a different Reference ticker changes the distribution of holes, you can open your workspace and step through (make current) different tickers in your database. The program checks the cursor position, and if you set Cursor-Selected Chart to SHOW (rather than HIDE), a price chart will be overlain on the chart for the selected ticker line. This allows you to zoom in and inspect prices in the immediate area surrounding the Hole or Padded data.
Note: Since there is no way to detect which pane the cursor is on, the cursor-position sensing will work only if the hole map is run in its own window.
Typical Hole-Maps
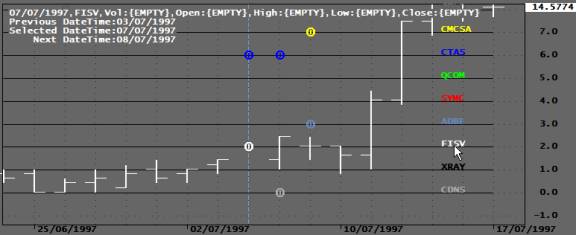
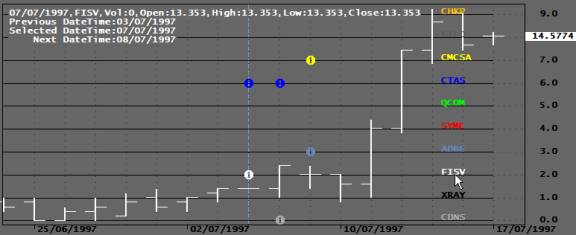
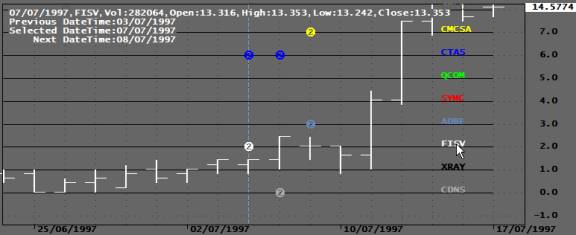
I the captures below, a NASDAQ 100 (N100) composite was used as reference for the ticker FISV. Each ticker in the chart (hole-map) below is assigned a horizontal time line on which the existence of holes is indicated with a small circle. Placing your cursor on a hole displays its date and data in the title. The color of the circles matches that of the ticker. The Y-axis numbers are the ticker numbers (redundant).
In the first case, the fixup parameter was set to zero and the bar location with missing bar is left empty (see cursor location). Because the digit is so small it may look like a ?1?, but it is actually a ?0?. The fact that a bar is missing means that the current symbol had data for this bar but the foreign ticker did NOT.

Fixup mode ‘0’
In the next capture a fixup parameter of 1 is used, and the missing bar is filled with the C price from the previous bar while the Volume (not shown) is set to zero.

Fixup mode ‘1’
In the next capture, the fixup parameter is set to 2, which results in the missing bar being Filled with OHLCV values from the previous bar.

Fixup mode ‘2’
In all the above examples, an EOD chart was used. However, it could just as well have been a 1-minute chart (or any other timeframe). Here is the code that produced the above charts:
RequestTimedRefresh(1);
GraphZOrder=True;
GraphXSpace = 10;
RefWLNum = Param("Reference WatchList",0,0,64,1);
MapWLNum = Param("WatchList to Map",8,0,64,1);
ScanTrigger = ParamTrigger("Reference Composite","CREATE COMP");
ShowChart = ParamToggle("Cursor-Selected Chart","HIDE|SHOW");
FixupSelection = ParamList("Fille Type (Fixup)","NO FIXUP (0)|PREVIOUS C to OHL (1)|PREVIOUS OHLCV (2)");
TMax = Param("Max. Number Tickers Scanned",50,1,200,1);
if( FixupSelection == "NO FIXUP (0)" ) FixupFlag = 0;
else if( FixupSelection == "PREVIOUS C to OHL (1)" ) FixupFlag = 1;
else if( FixupSelection == "PREVIOUS OHLCV (2)" ) FixupFlag = 2;
MapTickers = CategoryGetSymbols(categoryWatchlist,MapWLNum);
FirstVisibleBar = Status("FirstVisibleBar");
Lastvisiblebar = Status("LastVisibleBar");
XText = Lastvisiblebar-(Lastvisiblebar-FirstVisibleBar)/10;
if( ScanTrigger )
{
RefTickers=CategoryGetSymbols(categoryWatchlist,RefWLNum);
for( T=0; (symbol=StrExtract(RefTickers,T))!="" AND T < Tmax; T++ )
{
Vt=Nz(Foreign(Symbol,"V",False))>0;
AddToComposite(VT,"~MarketVolume","V",1|2|128);
}
}
else
{
for( T=0; (symbol=StrExtract(MapTickers,T))!=""; T++ )
{
VT1= Foreign(symbol,"V",FixupFlag);
F0 = IsNull(VT1);
F1 = VT1 == 0;
F2 = VT1 == Ref(VT1,-1);
VT = Nz(VT1);
if(T>15) Co = T - int(T/15)*15; else Co = T;
Plot(T,"",colorBlack,styleLine|styleNoLabel);
PlotShapes(IIf(F0,shapeDigit0,IIf(F1,shapeDigit1,IIf(F2,shapeDigit2,shapeNone))),Co,0,T,0);
PlotText(""+symbol,XText,T,Co);
}
}
DT=DateTime();
TickerNumber=round(GetCursorYPosition());
SelectedTicker=StrExtract(MapTickers,TickerNumber);
DateTimeNum=GetCursorXPosition();
if(TickerNumber>15)Co=TickerNumber-int(TickerNumber/15)*15;else Co=TickerNumber;
SetForeign(SelectedTicker,FixupFlag);
if(ShowChart) Plot(C,"",Co,styleBar|styleOwnScale|styleThick);
if( SelectedTicker == "" ) SelectedTicker = Name();
Title="\n"+EncodeColor(Co)+
NumToStr(SelectedValue(DT),formatDateTime)+","+SelectedTicker+",Vol:"+NumToStr(V,1.0,False)+","+
"Open:"+NumToStr(O,1.3)+","+"High:"+NumToStr(H,1.3)+","+"Low:"+NumToStr(L,1.3)+","+"Close:"+NumToStr(C,1.3)+"\n"+
"Previous DateTime:"+NumToStr(Ref(DT,-1),formatDateTime)+"\n"+
"Selected DateTime:"+NumToStr(DT,formatDateTime)+"\n"+
" Next DateTime:"+NumToStr(Ref(DT,1),formatDateTime);
Edited by Al Venosa
 Filed by Herman at 5:59 pm under Real-Time AFL Programming
Comments Off on Data Holes in Real-Time Trading
