Finding Pixel Boundaries

Important note: The AmiBroker 5.09.0 Beta introduced the following new GFX functions:

Status(“pxchartleft”) – returns x-coordinate of top-left corner of chart area
Status(“pxcharttop”) – returns y-coordinate of top-left corner of chart area
Status(“pxchartright”) – returns x-coordinate of bottom-right corner of chart area
Status(“pxchartbottom”) – returns y-coordinate of bottom-right corner of chart area
Status(“pxchartwidth”) – returns width chart area (right-left)
Status(“pxchartheight”) – returns width chart area (bottom-top)

Since this release appeared after this post was published these functions are not used in the examples below. This post has been left unchanged for educational purposes. For examples using the new functions please see the 5.09.0 Read Me file.

=====

The first requirement when designing chart overlays and/or control panels is to know the exact dimensions of your charting pane. These are expressed in pixels. The numerical values where the margins (the four edges of your charting pane) are located depends on the resolution of your monitor, the size of the chart pane, and the fonts used to label your axis.

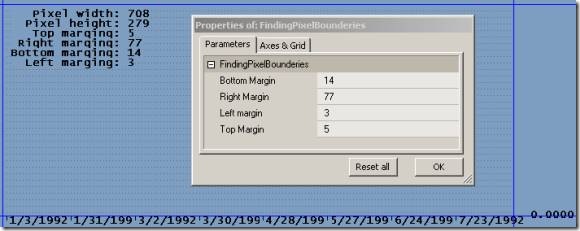
Currently the only way to obtain the values is, as far as I know, to determine the pane boundaries manually. The code below plots four lines that you can position using sliders in the Param window. When the lines fall exactly on the edges of your charting pane you can read the pixel value in the Param window and in the chart Title. See the image below and note how the blue lines hide the regular black chart frame:

clip_image002

Try changing the size of your charting pane, the overall AmiBroker window, and the font for the axis, to see how the pixel values change. Be aware that opening multiple chart panes and/or windows will also change pixel values. Also, probably to ensure that the first bar shows, the left edge of your charting pane is located at the third pixel, while actual bars start plotting at the fifth pixel. This means that trying to overlay the Blue line to determine the left boundary will be offset to the left by two pixels. To use the code below copy it to a new Indicator formula window and click Apply.

function gfxPlotHLineYPixelsColor )
{
    global pxwidth;
    GfxSelectPenColor ) ;
    GfxMoveTo0YPixels );
    GfxLineTopxwidthYPixels );
}

function gfxPlotVLineXPixelsColor )
{
    global pxheight;
    GfxSelectPenColor ) ;
    GfxMoveToXPixels);
    GfxLineToXPixelspxheight );
}

GraphXSpace 0;
SetChartOptions2chartHideQuoteMarker );

pxwidth Status"pxwidth" );
pxheight Status"pxheight" );

BottomMargin Param"Bottom Margin"140100 );
gfxPlotHLinepxheight BottomMargin);

RightMargin Param"Right Margin"770100 );
gfxPlotVLinepxwidth RightMargin);

LeftMargin Param"Left margin"30100 );
gfxPlotVLineLeftMargin);

TopMargin Param"Top Margin"50100 );
gfxPlotHLineTopMargin);

Title="\n"+
"   Pixel width: "+NumToStr(pxwidth,1.0,False)+"\n"+
"  Pixel height: "+NumToStr(pxheight,1.0,False)+"\n"+
"   Top marging: "+NumToStr(TopMargin,1.0,False)+"\n"+
" Right marging: "+NumToStr(RightMargin,1.0,False)+"\n"+
"Bottom marging: "+NumToStr(BottomMargin,1.0,False)+"\n"+
"  Left marging: "+NumToStr(LeftMargin,1.0,False);

Button Rotate

A ButtonRotate function is like a ParamToggle() but with multiple states. The ButtonRotate function returns the label displayed on the button, and selects the next label each time you click the button. In the example below the ButtonRotate is used to select the next action, which can be Buy, Sell, Short, Cover, Cash, or Reverse. The end result of using this function is similar to using the ParamList() however it is much quicker to use. When the action is selected the order can be transmitted using the Transmit ButtonTrigger().The function returns the displayed label; sometimes the label can be used directly in PlaceOrder(), at other times you may have to use an if() comparison to know which action to perform. For debugging purposes the Title shows the returned values:

rotatebutton.png

The ButtonRotate() is listed below for discussion. There is no need to copy this because it is included in the Include file at the end of this post.

function ButtonRotateLabelStrBackColorStrTextColorStr )
{
    global ColNumberRowNumberColNameColExpanded;

    if ( ColExpanded )
    {
        ColName VarGetText"ColName" );
        RowNumber NzkStaticVarGet"RowNumber" ColName ) ) + 1;
        kStaticVarSet"RowNumber" ColNameRowNumber );
        Rotate GetButtonClickColNumberRowNumber );
        if ( Rotate OR IsNullStaticVarGet("RotateInit"ColName RowNumber ) ) )
        {
            RotateIndex NzkStaticVarGet"RotateIndex" ColName RowNumber ) );
            if ( StrExtractLabelStrRotateIndex 1) != "" RotateIndex++;
            else RotateIndex 0;
            kStaticVarSet"RotateIndex" ColName RowNumberRotateIndex );

            Label StrExtractLabelStrRotateIndex );

            if ( StrExtractBackColorStrRotateIndex ) == "" BackColor StrToNumStrExtractBackColorStr) );
            else BackColor StrToNumStrExtractBackColorStrRotateIndex ) );

            if ( StrExtractTextColorStrRotateIndex ) == "" TextColor StrToNumStrExtractTextColorStr) );
            else TextColor =     StrToNumStrExtractTextColorStrRotateIndex ) );

            kStaticVarSetText"Label" ColName RowNumberLabel );
            kStaticVarSet"TextColor" ColName RowNumberTextColor );
            kStaticVarSet"BackColor" ColName RowNumberBackColor );
                StaticVarSet("RotateInit"ColName RowNumberTrue);
        }
    }
    Label     kStaticVarGetText"Label" ColName RowNumber);
    return Label;
}

Referring to the above code you’ll see the usual ColExpanded variable that determines whether this button will be displayed. A RotateInit var is used to detect whether the button has been initialized, i.e., whether is was assigned colors and text. Each time the function is called the RotateIndex incremented. This index is used to extract the proper label and color from the csv encoded options in the string argument for the function.

The code below demonstrates how the ButtonRotate is used. Note that for brevity I used digits to indicate colors. You can also use constants like ColorRed, ColorBlue, etc.

#include <ControlPanelInclude-004.afl>

global ColNumber;
RequestTimedRefresh(1);
ButtonHeight            Param("Button Height",20,5,200,1); 
ButtonWidth             Param("Button Width",120,5,200,1); 
PanelYoffset             Param("Button Row Offset (px)",10,0,Status("pxheight"),1); 
PanelXoffset            Param("Button Column Offset (px)",10,0,Status("pxwidth"),1); 
FontRatio               Param("Font: ButtonHeight ratio",2,1,20,0.1);
DoubleClickInterval    Param("Double Click Max. Interval",330,1,1000,1);

ButtonColumnBegin"1" );
ButtonHeader"HEADER"colorBluecolorBlue,colorWhite);
ButtonText"TRADING ENABLED"colorYellowcolorBlue);

Action=ButtonRotate"BUY,SELL,SHORT,COVER,CASH,REVERSE""6,5,1,3,2,4""2,3,4,5,6,1" );
Transmit ButtonTrigger"TRANSMIT"colorBrightGreencolorRedcolorBlack);
ButtonColumnEnd( );

ClickCoordinates Nz(StaticVarGet("ClickCoordinates"));
switch( ClickCoordinates )
    {
    case 101:
    // Perform Button task 101 here
    break;
    case 102:
    // Perform Button task 102 here
    break;
    // etc.
    }

Plot(C,"",1,128);

Title "\n"+
"Button Coordinates: "+ClickCoordinates+"\n"+
"Action: "+Action+"\n"+

As always, here follows the revised Include file with the ButtonRotate() included.

// ControlPanelInclude-004.afl
procedure kStaticVarSetSNameSValue )         
    {
    ChartID GetChartID();
    InIndicator Status("Action") == 1;
    if( InIndicator StaticVarSet(Sname+ChartIDSvalue); 
    }

function kStaticVarGetSName )                     
    { 
    ChartID     GetChartID();
    Var = StaticVarGet(Sname+ChartID);
    return Var;
    }

procedure kStaticVarSetTextSNameSValue )     
    { 
    ChartID     GetChartID();
    InIndicator Status("Action") == 1;
    if( InIndicator StaticVarSetText(Sname+ChartIDSvalue); 
    }

function kStaticVarGetTextSName )                 
    { 
    ChartID GetChartID();
    return StaticVarGetText(Sname+ChartID); 
    }

function NewColumn()
    {
    VarSet("ColNumber"0);
    }

function GetButtonClickColNumberRowNumber )
    {
    global PanelYoffsetPanelXoffsetButtonHeightButtonWidth;
    LButtonDown GetCursorMouseButtons() == 9;
    Click False;
    if( LButtonDown )
        {
        ULButtonX     PanelXoffset + (ColNumber-1) * ButtonWidth;
        LRButtonX    ULButtonX ButtonWidth;
        ULButtonY     = (RowNumber -1) * ButtonHeight PanelYoffset;
        LRButtonY    ULButtonY ButtonHeight;
        MouseCoord     Nz(StaticVarGet("ClickCoordinates"));
        if( MouseCoord == AND LButtonDown )
            {
            MousePx GetCursorXPosition);
            MousePy GetCursorYPosition);
            if( MousePx ULButtonX AND MousePx LRButtonX AND MousePy ULButtonY AND MousePy LRButtonY )
                {
                StaticVarSet("ClickCoordinates",ColNumber*100+RowNumber);
                Click 1;
                }
            }
        }
    return Click;
    }

function ButtonColumnBeginColName ) 
    {
    global FontRatioColNameColNumberButtonHeightButtonWidthPanelXoffsetPanelYoffsetColname;
    ColNumber VarGet("ColNumber");
    if( IsEmptyColNumber ) ) 
        {
        VarSet("ColNumber",1);
        StaticVarSet("ClickCoordinates",0);
        }
    else VarSet("ColNumber", ++ColNumber);
    ColName ColName+GetChartID();
    kStaticVarSet("RowNumber"+ColName0);
    VarSetText("ColName",ColName);
    GfxSetOverlayMode);
    GfxSelectFont"Tahoma"ButtonHeight/FontRatio800 ); 
    GfxSelectPencolorBlack ); 
    GfxSetBkMode);
    }

function ButtonHeaderLabelbackColor1BackColor2TextColor)
    {
    global ColNumberRowNumberColExpandedColname;
    RowNumber Nz(kStaticVarGet("RowNumber"+ColName))+1;
    kStaticVarSet("RowNumber"+ColNameRowNumber);
    SingleClick GetButtonClickColNumberRowNumber );
    BackColor backColor1;
    ColExpanded Nz(kStaticVarGet(ColName+"ColExpanded"));
    if( SingleClick ) 
        {
        BackColor backColor2; 
        ColExpanded Nz(kStaticVarGet(ColName+"ColExpanded"));
        if( ColExpanded kStaticVarSet(ColName+"ColExpanded"False);
        else kStaticVarSet(ColName+"ColExpanded"True);
        }
    ColExpanded Nz(kStaticVarGet(ColName+"ColExpanded"));
    kStaticVarSetText("Label"+ColName+RowNumberLabel);
    kStaticVarSet("TextColor"+ColName+RowNumberTextColor);
    kStaticVarSet("BackColor"+ColName+RowNumberbackColor);
    }

function ButtonTextLabelbackColorTextColor)
    {
    global ColNumberRowNumberColname;
    ColExpanded Nz(kStaticVarGet(ColName+"ColExpanded"));
    if( ColExpanded )
        {
        ColName VarGetText("ColName");
        RowNumber Nz(kStaticVarGet("RowNumber"+ColName))+1;
        kStaticVarSet("RowNumber"+ColNameRowNumber);
        kStaticVarSetText("Label"+ColName+RowNumberLabel);
        kStaticVarSet("TextColor"+ColName+RowNumberTextColor);
        kStaticVarSet("BackColor"+ColName+RowNumberbackColor);
        }
    }

function ButtonTriggerLabelbackColor1BackColor2TextColor)
    {
    global ColNumberRowNumberColName;
    ColExpanded Nz(kStaticVarGet(ColName+"ColExpanded"));
    if( ColExpanded )
        {
        ColName VarGetText("ColName");
        RowNumber Nz(kStaticVarGet("RowNumber"+ColName))+1;
        kStaticVarSet("RowNumber"+ColNameRowNumber);
        Trigger GetButtonClickColNumberRowNumber );
        if( Trigger BackColor backColor2; else BackColor backColor1;
        kStaticVarSetText("Label"+ColName+RowNumberLabel);
        kStaticVarSet("TextColor"+ColName+RowNumberTextColor);
        kStaticVarSet("BackColor"+ColName+RowNumberbackColor);
        }
    else Trigger 0;
    return Trigger;
    }

function ButtonRotateLabelStrBackColorStrTextColorStr )
{
    global ColNumberRowNumberColNameColExpanded;

    if ( ColExpanded )
    {
        ColName VarGetText"ColName" );
        RowNumber NzkStaticVarGet"RowNumber" ColName ) ) + 1;
        kStaticVarSet"RowNumber" ColNameRowNumber );
        Rotate GetButtonClickColNumberRowNumber );
        if ( Rotate OR IsNullStaticVarGet("RotateInit"ColName RowNumber ) ) )
        {
            RotateIndex NzkStaticVarGet"RotateIndex" ColName RowNumber ) );
            if ( StrExtractLabelStrRotateIndex 1) != "" RotateIndex++;
            else RotateIndex 0;
            kStaticVarSet"RotateIndex" ColName RowNumberRotateIndex );

            Label StrExtractLabelStrRotateIndex );

            if ( StrExtractBackColorStrRotateIndex ) == "" BackColor StrToNumStrExtractBackColorStr) );
            else BackColor StrToNumStrExtractBackColorStrRotateIndex ) );

            if ( StrExtractTextColorStrRotateIndex ) == "" TextColor StrToNumStrExtractTextColorStr) );
            else TextColor =     StrToNumStrExtractTextColorStrRotateIndex ) );

            kStaticVarSetText"Label" ColName RowNumberLabel );
            kStaticVarSet"TextColor" ColName RowNumberTextColor );
            kStaticVarSet"BackColor" ColName RowNumberBackColor );
                StaticVarSet("RotateInit"ColName RowNumberTrue);
        }
    }
    Label     kStaticVarGetText"Label" ColName RowNumber);
    return Label;
}


function ButtonColumnEnd()
    {
    global ButtonHeightButtonWidthPanelYoffsetPanelXoffsetColNumberRowNumberColName;
    ChartIDStr     NumToStr(GetChartID(),1.0,False);
    ULButtonX         PanelXoffset + (ColNumber-1) * ButtonWidth;
    LRButtonX        ULButtonX ButtonWidth;
    for( Row 1Row <= RowNumberRow++ ) 
        {
        ULButtonY         = (Row-1) * ButtonHeight PanelYoffset;
        LRButtonY        ULButtonY ButtonHeight;
        Label     kStaticVarGetText("Label"+ColName+Row);
        TextColor     Nz(kStaticVarGet("TextColor"+ColName+Row));
        BackColor     Nz(kStaticVarGet("BackColor"+ColName+Row));
        GfxSelectSolidBrushBackColor);
        GfxRectangleULButtonXULButtonYLRButtonXLRButtonY ); 
        GfxSetBkColorBackColor);
        GfxSetTextColorTextColor );
        GfxDrawTextLabelULButtonXULButtonYLRButtonXLRButtonY32 4);
        }

Button Header (Collapse/Expand)

Note: A number of variables and function names were changed to provide more consistent naming; please upgrade your code and Include file. I regret that such changes may happen rather often, however, the only alternative would be to complete all posts for this topic and publish them all at once. Since there is no guarantee that all code will ever be fully completed (most of my development work never stops), I think it is better to publish whatever is functional, as if this were a development blog.

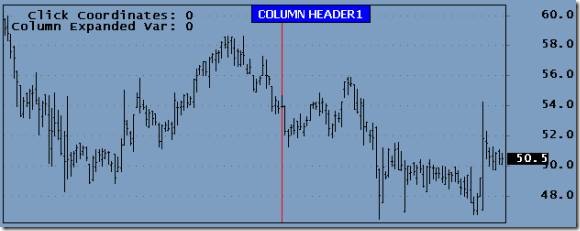
The purpose of the Button Header is to name button columns (this is needed to key static variables) and provide a Collapse/Expand function for Button Columns. Clicking on a Button Header will alternatively Collapse and Expand button columns. This allows you to quickly expose chart sections that were hidden by the Control Panel. A collapsed Button Column will look like this:

clip_image002

Clicking on the Header Button will expand the column to look as show below:

clip_image002[5]

A few variables are displayed in the Title to facilitate debugging. The following listing shows the test code used to display the above Button Column. Note again that there are two ways to process button clicks: using the values returned by the button functions, or using the Switch() statement.

#include <ControlPanelInclude-003.afl>

global ColNumber;
RequestTimedRefresh(1);
ButtonHeight Param("Button Height",20,5,200,1); 
ButtonWidth Param("Button Width",120,5,200,1); 
PanelYoffset Param("Button Row Offset (px)",10,0,Status("pxheight"),1); 
PanelXoffset Param("Button Column Offset (px)",10,0,Status("pxwidth"),1); 
FontRatio Param("Font: ButtonHeight ratio",2,1,20,0.1);

ButtonColumnBegin"1" );
ButtonHeader"COLUMN HEADER1"colorBluecolorLightBlue,colorWhite);
ButtonText"AUTO-TRADING ON"colorBluecolorWhite);
Reset ButtonTrigger"START SESSION"colorBrightGreencolorRedcolorBlack);
CancelAll ButtonTrigger"CANCEL ALL"colorBrightGreencolorRedcolorBlack);
CloseAll ButtonTrigger"CLOSE ALL"colorBrightGreencolorRedcolorBlack);
EndSession ButtonTrigger"END SESSION"colorBrightGreencolorRedcolorBlack);
ButtonColumnEnd( );

ClickCoordinates Nz(StaticVarGet("ClickCoordinates"));
switch( ClickCoordinates )
    {
    case 101:
    Say"1 1");
    break;
    case 102:
    Say"1 2");
    break;
    case 103:
    Say"1 3");
    break;
    case 104:
    Say"1 4");
    break;
    case 105:
    Say"1 5");
    break;
    case 106:
    Say"1 6");
    break;
    }

Plot(C,"",1,128);

Title "\n"+
"  Click Coordinates: "+ClickCoordinates+"\n"+
"Column Expanded Var: "+Nz(kStaticVarGet(ColName+"ColExpanded"));

The ButtonHeader() is similar to the ButtonText() function but has a Collapse/Expand variable added. Here is the code for the new ButtonHeader() function:

function ButtonHeaderLabelbackColor1BackColor2TextColor)
    {
    global ColNumberRowNumberColExpandedColname;
    RowNumber Nz(kStaticVarGet("RowNumber"+ColName))+1;
    kStaticVarSet("RowNumber"+ColNameRowNumber);
    Trigger GetMouseClickColNumberRowNumber );
    if( Trigger ) 
        {
        BackColor backColor2; 
        ColExpanded Nz(kStaticVarGet(ColName+"ColExpanded"));
        if( ColExpanded kStaticVarSet(ColName+"ColExpanded"False);
        else kStaticVarSet(ColName+"ColExpanded"True);
        }
    else BackColor backColor1;
    ColExpanded Nz(kStaticVarGet(ColName+"ColExpanded"));
    kStaticVarSetText("TextButton"+ColName+RowNumberLabel);
    kStaticVarSet("TextColor"+ColName+RowNumberTextColor);
    kStaticVarSet("BackColor"+ColName+RowNumberbackColor);
    }

In the above code, when the left Mouse button is clicked, a static variable named ColExpanded is toggled between True and False. All earlier button functions have been modified to only execute their internal code only if this variable is True. This way Buttons will only display if the variable ColExpanded it True. The listing below shows how the TriggerButton() was modified. This and the HeaderButton functions are located in the Include file at the end of this post; there is no need to copy them separately.

function ButtonTriggerLabelbackColor1BackColor2TextColor)
    {
    global ColNumberRowNumberColName;
    ColExpanded Nz(kStaticVarGet(ColName+"ColExpanded"));
    if( ColExpanded )
        {
        ColName VarGetText("ColName");
        RowNumber Nz(kStaticVarGet("RowNumber"+ColName))+1;
        kStaticVarSet("RowNumber"+ColNameRowNumber);
        Trigger GetMouseClickColNumberRowNumber );
        if( Trigger BackColor backColor2; else BackColor backColor1;
        kStaticVarSetText("TextButton"+ColName+RowNumberLabel);
        kStaticVarSet("TextColor"+ColName+RowNumberTextColor);
        kStaticVarSet("BackColor"+ColName+RowNumberbackColor);
        }
    else Trigger 0;
    return Trigger;
    }  

The new ControlPanelInclude-003.afl Include file is listed below, it must be copied to your default Include folder for the above code to work.

// ControlPanelInclude-003.afl
procedure kStaticVarSetSNameSValue )         
    {
    ChartID GetChartID();
    InIndicator Status("Action") == 1;
    if( InIndicator StaticVarSet(Sname+ChartIDSvalue); 
    }

function kStaticVarGetSName )                     
    { 
    ChartID     GetChartID();
    Var = StaticVarGet(Sname+ChartID);
    return Var;
    }

procedure kStaticVarSetTextSNameSValue )     
    { 
    ChartID     GetChartID();
    InIndicator Status("Action") == 1;
    if( InIndicator StaticVarSetText(Sname+ChartIDSvalue); 
    }

function kStaticVarGetTextSName )                 
    { 
    ChartID GetChartID();
    return StaticVarGetText(Sname+ChartID); 
    }

function NewColumn()
    {
    VarSet("ColNumber"0);
    }

function GetMouseClickColNumberRowNumber )
    {
    global PanelYoffsetPanelXoffsetButtonHeightButtonWidth;
    LButtonDown GetCursorMouseButtons() == 9;
    Click 0;
    if( LButtonDown )
        {
        ULButtonX         PanelXoffset + (ColNumber-1) * ButtonWidth;
        LRButtonX        ULButtonX ButtonWidth;
        ULButtonY         = (RowNumber -1) * ButtonHeight PanelYoffset;
        LRButtonY        ULButtonY ButtonHeight;
        MouseCoord Nz(StaticVarGet("ClickCoordinates"));
        if( MouseCoord == AND LButtonDown )
            {
            MousePx GetCursorXPosition);
            MousePy GetCursorYPosition);
            if( MousePx ULButtonX AND MousePx LRButtonX AND MousePy ULButtonY AND MousePy LRButtonY )
                {
                StaticVarSet("ClickCoordinates",ColNumber*100+RowNumber);
                Click 1;
                }
            }
        }
    return Click;
    }

function ButtonColumnBeginColName ) 
    {
    global FontRatioColNameColNumberButtonHeightButtonWidthPanelXoffsetPanelYoffsetColname;
    ColNumber VarGet("ColNumber");
    if( IsEmptyColNumber ) ) 
        {
        VarSet("ColNumber",1);
        StaticVarSet("ClickCoordinates",0);
        }
    else VarSet("ColNumber", ++ColNumber);
    ColName ColName+GetChartID();
    kStaticVarSet("RowNumber"+ColName0);
    VarSetText("ColName",ColName);
    GfxSetOverlayMode);
    GfxSelectFont"Tahoma"ButtonHeight/FontRatio800 ); 
    GfxSelectPencolorBlack ); 
    GfxSetBkMode);
    }

function ButtonTextTextButtonbackColorTextColor)
    {
    global ColNumberRowNumberColname;
    ColExpanded Nz(kStaticVarGet(ColName+"ColExpanded"));
    if( ColExpanded )
        {
        ColName VarGetText("ColName");
        RowNumber Nz(kStaticVarGet("RowNumber"+ColName))+1;
        kStaticVarSet("RowNumber"+ColNameRowNumber);
        kStaticVarSetText("TextButton"+ColName+RowNumberTextButton);
        kStaticVarSet("TextColor"+ColName+RowNumberTextColor);
        kStaticVarSet("BackColor"+ColName+RowNumberbackColor);
        }
    }

function ButtonTriggerLabelbackColor1BackColor2TextColor)
    {
    global ColNumberRowNumberColName;
    ColExpanded Nz(kStaticVarGet(ColName+"ColExpanded"));
    if( ColExpanded )
        {
        ColName VarGetText("ColName");
        RowNumber Nz(kStaticVarGet("RowNumber"+ColName))+1;
        kStaticVarSet("RowNumber"+ColNameRowNumber);
        Trigger GetMouseClickColNumberRowNumber );
        if( Trigger BackColor backColor2; else BackColor backColor1;
        kStaticVarSetText("TextButton"+ColName+RowNumberLabel);
        kStaticVarSet("TextColor"+ColName+RowNumberTextColor);
        kStaticVarSet("BackColor"+ColName+RowNumberbackColor);
        }
    else Trigger 0;
    return Trigger;
    }

function ButtonHeaderLabelbackColor1BackColor2TextColor)
    {
    global ColNumberRowNumberColExpandedColname;
    RowNumber Nz(kStaticVarGet("RowNumber"+ColName))+1;
    kStaticVarSet("RowNumber"+ColNameRowNumber);
    Trigger GetMouseClickColNumberRowNumber );
    if( Trigger ) 
        {
        BackColor backColor2; 
        ColExpanded Nz(kStaticVarGet(ColName+"ColExpanded"));
        if( ColExpanded kStaticVarSet(ColName+"ColExpanded"False);
        else kStaticVarSet(ColName+"ColExpanded"True);
        }
    else BackColor backColor1;
    ColExpanded Nz(kStaticVarGet(ColName+"ColExpanded"));
    kStaticVarSetText("TextButton"+ColName+RowNumberLabel);
    kStaticVarSet("TextColor"+ColName+RowNumberTextColor);
    kStaticVarSet("BackColor"+ColName+RowNumberbackColor);
    }

function ButtonColumnEnd()
    {
    global ButtonHeightButtonWidthPanelYoffsetPanelXoffsetColNumberRowNumberColName;
    ChartIDStr     NumToStr(GetChartID(),1.0,False);
    ULButtonX         PanelXoffset + (ColNumber-1) * ButtonWidth;
    LRButtonX        ULButtonX ButtonWidth;
    for( Row 1Row <= RowNumberRow++ ) 
        {
        ULButtonY         = (Row-1) * ButtonHeight PanelYoffset;
        LRButtonY        ULButtonY ButtonHeight;
        Label     kStaticVarGetText("TextButton"+ColName+Row);
        TextColor     Nz(kStaticVarGet("TextColor"+ColName+Row));
        BackColor     Nz(kStaticVarGet("BackColor"+ColName+Row));
        GfxSelectSolidBrushBackColor);
        GfxRectangleULButtonXULButtonYLRButtonXLRButtonY ); 
        GfxSetBkColorBackColor);
        GfxSetTextColorTextColor );
        GfxDrawTextLabelULButtonXULButtonYLRButtonXLRButtonY32 4);
        }
    }

Command Buttons (Trigger type)

This series of posts is actually written while the functions are being developed. It is for this reason that the functions and Include file may change with each next post. Hopefully they will be better with each revision. Please always use the latest versions.

There have been many requests for on-chart custom Command Buttons. Command Buttons are mouse-click sensitive buttons or menu-items that, when clicked on, will execute a specific section of AFL code. This post introduces Command Buttons of the Trigger-type that respond to Left-Button clicks. This Trigger Button can be used in the same way you would use the ParamTrigger() function. Note that the first button does not respond to mouse-clicks; it is not a trigger button. The TextCell was designed to display text only, for example to display status information for your trading system. Here is an example of a simple horizontal layout:

triggerbuttons.png

To display the buttons horizontally lengthens the code a little because the code is optimized for vertical button columns. Here is the code that places the above button array on your chart:

#include <ControlPanelInclude-001.afl>

global ColNumber;
RequestTimedRefresh(1);
CellHeight Param("Cell Height",20,5,200,1); 
CellWidth Param("Cell Width",120,5,200,1); 
PanelYoffset Param("Cell Row Offset (px)",10,0,Status("pxheight"),1); 
PanelXoffset Param("Cell Column Offset (px)",10,0,Status("pxwidth"),1); 
FontRatio Param("Font: CellHeight ratio",2,1,20,0.1);

Column_Begin"1" );
TextCell"AUTO-TRADING"colorRedcolorBlack);
Column_End( );

Column_Begin"2" );
Reset TriggerCell"START SESSION"colorBrightGreencolorRedcolorBlack);
Column_End( );

Column_Begin"3" );
CancelAll TriggerCell"CANCEL ALL"colorBrightGreencolorRedcolorBlack);
Column_End( );

Column_Begin"4" );
CloseAll TriggerCell"CLOSE ALL"colorBrightGreencolorRedcolorBlack);
Column_End( );

Column_Begin"5");
EndSession TriggerCell"END SESSION"colorBrightGreencolorRedcolorBlack);
Column_End( );

ClickCoordinates Nz(StaticVarGet("ClickCoordinates"));
switch( ClickCoordinates )
    {
    case 201:
    Say"201");
    break;
    case 301:
    Say"301");
    break;
    case 401:
    Say"401");
    break;
    case 501:
    Say"501");
    break;
    }

Plot(C,"",1,128);

Title "CLICK COORDINATES: "+ClickCoordinates;

The Trigger function returns a trigger, i.e., a True state that lasts only for the current refresh and that returns False at the next pass through the code. A Triggername is assigned to each button and is used to key the static variables. Backcolor1 is the normal color of the button. Backcolor2 is the color the button takes on when it is clicked on; this gives a visual confirmation that the click was registered. If a button is clicked on, the button coordinates (vertical position, horizontal position) are returned in compressed for as ColNumber*100+RowNumber.

Trigger action can be invoked in two ways: by checking the value returned by the trigger functions, and by processing the click-coordinates in a Switch() statement. Each method may have advantages depending on the application.

Below a listing of the revised Include file, please copy to your default include folder.

// ControlPanelInclude-001.afl
procedure kStaticVarSetSNameSValue )         
    {
    ChartID GetChartID();
    InIndicator Status("Action") == 1;
    if( InIndicator StaticVarSet(Sname+ChartIDSvalue); 
    }

function kStaticVarGetSName )                     
    { 
    ChartID     GetChartID();
    Var = StaticVarGet(Sname+ChartID);
    return Var;
    }

procedure kStaticVarSetTextSNameSValue )     
    { 
    ChartID     GetChartID();
    InIndicator Status("Action") == 1;
    if( InIndicator StaticVarSetText(Sname+ChartIDSvalue); 
    }

function kStaticVarGetTextSName )                 
    { 
    ChartID GetChartID();
    return StaticVarGetText(Sname+ChartID); 
    }

function Column_BeginColName ) 
    {
    global FontRatioColNameColNumberCellHeightCellWidthPanelXoffsetPanelYoffset;
    ColNumber VarGet("ColNumber");
    if( IsEmptyColNumber ) ) 
        {
        VarSet("ColNumber",1);
        StaticVarSet("ClickCoordinates",0);
        }
    else VarSet("ColNumber", ++ColNumber);
    ColName ColName+GetChartID();
    GfxSetOverlayMode);
    GfxSelectFont"Tahoma"CellHeight/FontRatio800 ); 
    GfxSelectPencolorBlack ); 
    GfxSetBkMode);
    kStaticVarSet("RowNumber"+ColName0);
    VarSetText("ColName",ColName);
    return ColNumber;
    }

function Column_End( )
    {
    global CellHeightCellWidthPanelYoffsetPanelXoffsetColNumberRowNumber;
    ChartIDStr     NumToStr(GetChartID(),1.0,False);
    ColName         VarGetText("ColName");
    ULCellX         PanelXoffset + (ColNumber-1) * CellWidth;
    LRCellX        ULCellX CellWidth;
    for( Row 1Row <= RowNumberRow++ ) 
        {
        ULCellY         = (Row-1) * CellHeight PanelYoffset;
        LRCellY        ULCellY CellHeight;
        TextCell     kStaticVarGetText("TextCell"+ColName+Row);
        TextColor     Nz(kStaticVarGet("TextColor"+ColName+Row));
        BackColor     Nz(kStaticVarGet("BackColor"+ColName+Row));
        GfxSelectSolidBrushBackColor);
        GfxRectangleULCellXULCellYLRCellXLRCellY ); 
        GfxSetBkColorBackColor);
        GfxSetTextColorTextColor );
        GfxDrawTextTextCellULCellXULCellYLRCellXLRCellY32 4);
        }
    }

function TextCellTextCellbackColorTextColor)
    {
    global ColNumberRowNumber;;
    ColName VarGetText("ColName");
    RowNumber Nz(kStaticVarGet("RowNumber"+ColName))+1;
    kStaticVarSet("RowNumber"+ColNameRowNumber);
    kStaticVarSetText("TextCell"+ColName+RowNumberTextCell);
    kStaticVarSet("TextColor"+ColName+RowNumberTextColor);
    kStaticVarSet("BackColor"+ColName+RowNumberbackColor);
    }

function NewColumn()
    {
    VarSet("ColNumber"0);
    }

function CheckMouseClickColNumberRowNumber )
    {
    global PanelYoffsetPanelXoffsetCellHeightCellWidth;
    LButtonDown GetCursorMouseButtons() == 9;
    Click 0;
    if( LButtonDown )
        {
        ULCellX         PanelXoffset + (ColNumber-1) * CellWidth;
        LRCellX        ULCellX CellWidth;
        ULCellY         = (RowNumber -1) * CellHeight PanelYoffset;
        LRCellY        ULCellY CellHeight;
        MouseCoord Nz(StaticVarGet("ClickCoordinates"));
        if( MouseCoord == AND LButtonDown )
            {
            MousePx GetCursorXPosition);
            MousePy GetCursorYPosition);
            if( MousePx ULCellX AND MousePx LRCellX AND MousePy ULCellY AND MousePy LRCellY )
                {
                StaticVarSet("ClickCoordinates",ColNumber*100+RowNumber);
                Click 1;
                }
            }
        }
    return Click;
    }

function TriggerCellLabelbackColor1BackColor2TextColor)
    {
    global ColNumberRowNumber;;
    ColName VarGetText("ColName");
    RowNumber Nz(kStaticVarGet("RowNumber"+ColName))+1;
    kStaticVarSet("RowNumber"+ColNameRowNumber);
    Trigger CheckMouseClickColNumberRowNumber );
    if( Trigger BackColor backColor2; else BackColor backColor1;
    kStaticVarSetText("TextCell"+ColName+RowNumberLabel);
    kStaticVarSet("TextColor"+ColName+RowNumberTextColor);
    kStaticVarSet("BackColor"+ColName+RowNumberbackColor);
    return Trigger;
    }  

A Basic Messaging Panel

Also see Moving Low Level Graphics (GFX) Objects on your Charts

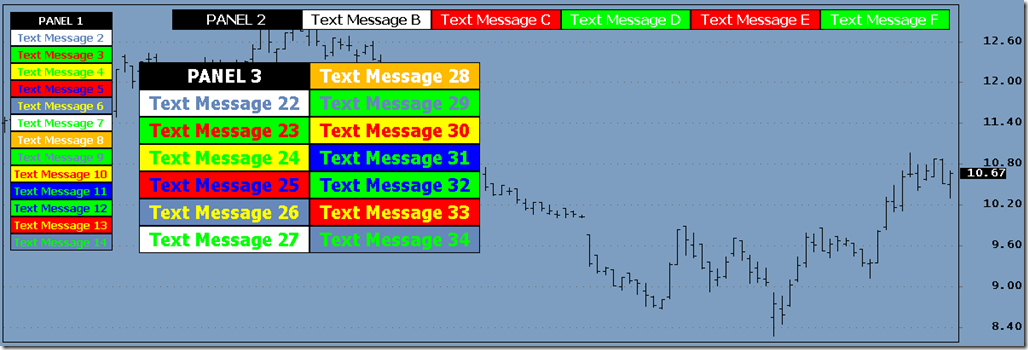
This first post introduces you to the basic techniques on how to create a matrix of text cells to display messages and system status on your chart. At this stage the cells are not mouse-click sensitive; this and other features will be added later. In this example the number of columns, rows, the font size, and the location of the message panel, can be set from the Param window. In your final application you might want to make these parameters constant and remove the corresponding Param statements. You can combine any number of Panels, here is an example for multiple panels layouts:

image

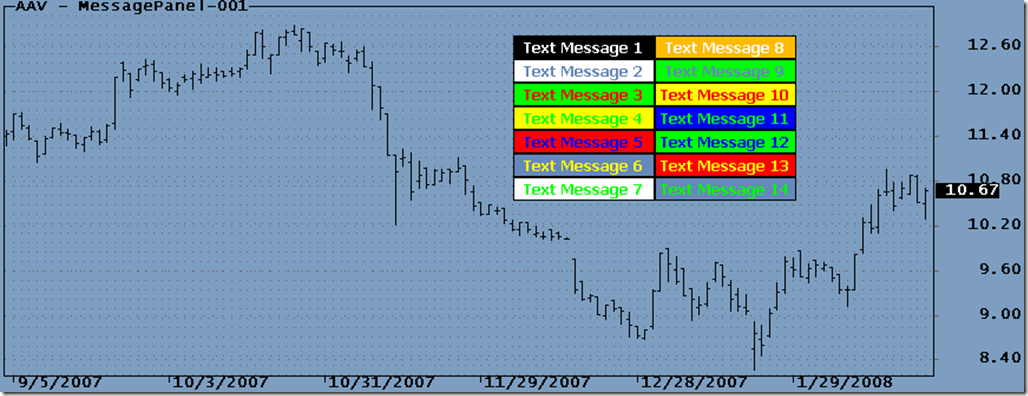
The following simple panel is produced by the code in this post.

image

The code below will place the above Message panel on your chart. A code description follows below listing.


#include &lt;MessagePanelInclude.afl&gt;

global ColNumber;

CellHeight Param("Cell Height",20,5,200,5);

CellWidth Param("Cell Width",120,5,200,5);

PanelYoffset Param("Cell Row Offset (px)",10,0,Status("pxheight"),5);

PanelXoffset Param("Cell Column Offset (px)",10,0,Status("pxwidth"),5);

FontRatio Param("Font:CellHeight ratio",2,1,20,0.1);

MsgCol_Begin"COLUMNNAME 1"CellHeightCellWidthPanelXoffsetPanelYoffset );

TextCell"Text Message 1"BackgroundColor=1TextColor=2);

TextCell"Text Message 2"23);

TextCell"Text Message 3"84);

TextCell"Text Message 4"75);

TextCell"Text Message 5"46);

TextCell"Text Message 6"37);

TextCell"Text Message 7"28);

MsgCol_End();

MsgCol_Begin" COLUMNNAME 2"CellHeightCellWidthPanelXoffsetPanelYoffset );

TextCell"Text Message 1"92);

TextCell"Text Message 2"83);

TextCell"Text Message 3"74);

TextCell"Text Message 4"65);

TextCell"Text Message 5"56);

TextCell"Text Message 6"47);

TextCell"Text Message 7"38);

MsgCol_End();

Message Panel code above calls the Include file listed at the end of this post. The The MsgCol_Begin() function defines the name and dimensions for the current column:

MsgCol_Begin"COLUMNNAME 1"CellHeightCellWidthPanelXoffsetPanelYoffset );

You can create many columns. The ColName is used in Static variables to allow the code to know to which Column the TextCells belong. The last four arguments are self-explanatory. The Overlay and background modes can be changed inside this function, or you can extract these GFX statements and execute them separately.

The TextCell() function adds one TextCell to the column. It defines the Message, Background color, and TextColor to be used:


TextCell"Text Message 1"colorBlackcolorWhite);

The MsgCol_End() terminates the current column and draws the GFX pgraphics to the chart.

The Include file makes extensive use of static variables that are wrapped in kStaticVar…() to make the static variables unique to the current ChartID. This is needed to call the functions from different panes and windows without interfering with one another. For more on this see Keying Static Variables.


// This is the Include file MessagePanelInclude.afl, copy to your default Include folder

procedure kStaticVarSetSNameSValue )

{

ChartID GetChartID();

InIndicator Status("Action") == 1;

if( InIndicator StaticVarSet(Sname+ChartIDSvalue);

}

function kStaticVarGetSName )

{

ChartID GetChartID();

Var = StaticVarGet(Sname+ChartID);

return Var;

}

procedure kStaticVarSetTextSNameSValue )

{

ChartID GetChartID();

InIndicator Status("Action") == 1;

if( InIndicator StaticVarSetText(Sname+ChartIDSvalue);

}

function kStaticVarGetTextSName )

{

ChartID GetChartID();

return StaticVarGetText(Sname+ChartID);

}

function MsgCol_BeginColNameCellHeightCellWidthPanelXoffsetPanelYoffset )

{

global FontRatioColNameColNumber;

ColNumber VarGet("ColNumber");

if( IsEmptyColNumber ) ) VarSet("ColNumber",1);

else VarSet("ColNumber", ++ColNumber);

ColName ColName+GetChartID();

GfxSetOverlayMode);

GfxSelectFont"Tahoma"CellHeight/FontRatio800 );

GfxSelectPencolorBlack );

GfxSetBkMode);

kStaticVarSet("PanelItemNum"+ColName0);

VarSetText("ColName",ColName);

return ColNumber;

}

function MsgCol_End( )

{

global CellHeightCellWidthPanelYoffsetPanelXoffsetColNumberPanelItemNum;

ChartIDStr NumToStr(GetChartID(),1.0,False);

ColName VarGetText("ColName");

ULCellX PanelXoffset + (ColNumber-1) * CellWidth;

LRCellX ULCellX CellWidth;

for( Row 1Row &lt;= PanelItemNumRow++ )

{

ULCellY = (Row-1) * CellHeight PanelYoffset;

LRCellY ULCellY CellHeight;

TextCell kStaticVarGetText("TextCell"+ColName+Row);

TextColor Nz(kStaticVarGet("TextColor"+ColName+Row));

BackColor Nz(kStaticVarGet("BackColor"+ColName+Row));

if( Row==1TextCell StrReplaceTextCellChartIDStr"");

GfxSelectSolidBrushBackColor);

GfxRectangleULCellXULCellYLRCellXLRCellY );

GfxSetBkColorBackColor);

GfxSetTextColorTextColor );

GfxDrawTextTextCellULCellXULCellYLRCellXLRCellY32 4);

}

}

function TextCellTextCellbackColorTextColor)

{

global InitializePanelsPanelVisible;

ColName VarGetText("ColName");

PanelItemNum Nz(kStaticVarGet("PanelItemNum"+ColName))+1;

kStaticVarSet("PanelItemNum"+ColNamePanelItemNum);

kStaticVarSet("CellState"+ColName+PanelItemNumFalse);

Label StrExtract(TextCell,0);

kStaticVarSetText("TextCell"+ColName+PanelItemNumLabel);

kStaticVarSet("TextColor"+ColName+PanelItemNumTextColor);

kStaticVarSet("BackColor"+ColName+PanelItemNumbackColor);

}

function Newpanel()

{

VarSet("ColNumber"0);

}

For those who want to experiment with multi-panel layouts here is the code used to produce the xample shown earlier:

#include

global ColNumber;
_SECTION_BEGIN("MESSAGE PANEL 1");
CellHeight                Param("Cell Height",20,5,200,1);
CellWidth                 Param("Cell Width",120,5,200,1);
PanelYoffset             Param("Cell Row Offset (px)",10,0,Status("pxheight"),1);
PanelXoffset            Param("Cell Column Offset (px)",10,0,Status("pxwidth"),1);
FontRatio               Param("Font:CellHeight ratio",2,1,20,0.1);

MsgCol_Begin"COLUMNNAME  1"CellHeightCellWidthPanelXoffsetPanelYoffset );
TextCell"PANEL 1"colorBlackcolorWhite);
TextCell"Text Message 2"23);
TextCell"Text Message 3"84);
TextCell"Text Message 4"75);
TextCell"Text Message 5"46);
TextCell"Text Message 6"37);
TextCell"Text Message 7"28);
TextCell"Text Message 8"92);
TextCell"Text Message 9"83);
TextCell"Text Message 10"74);
TextCell"Text Message 11"65);
TextCell"Text Message 12"56);
TextCell"Text Message 13"47);
TextCell"Text Message 14"38);
MsgCol_End();
_SECTION_END();

_SECTION_BEGIN("MESSAGE PANEL 2");
CellHeight                Param("2Cell Height",20,5,200,1);
CellWidth                 Param("2Cell Width",120,5,200,1);
PanelYoffset             Param("2Cell Row Offset (px)",10,0,Status("pxheight"),1);
PanelXoffset            Param("2Cell Column Offset (px)",10,0,Status("pxwidth"),1);
FontRatio               Param("2Font:CellHeight ratio",2,1,20,0.1);

Newpanel();
MsgCol_Begin"COLUMNNAME  1"CellHeightCellWidthPanelXoffsetPanelYoffset );
TextCell"PANEL 2"1colorWhite);
MsgCol_End();
MsgCol_Begin"COLUMNNAME  1"CellHeightCellWidthPanelXoffsetPanelYoffset );
TextCell"Text Message B"21);
MsgCol_End();
MsgCol_Begin"COLUMNNAME  1"CellHeightCellWidthPanelXoffsetPanelYoffset );
TextCell"Text Message C"4colorWhite);
MsgCol_End();
MsgCol_Begin"COLUMNNAME  1"CellHeightCellWidthPanelXoffsetPanelYoffset );
TextCell"Text Message D"5colorWhite);
MsgCol_End();
MsgCol_Begin"COLUMNNAME  1"CellHeightCellWidthPanelXoffsetPanelYoffset );
TextCell"Text Message E"4colorWhite);
MsgCol_End();
MsgCol_Begin"COLUMNNAME  1"CellHeightCellWidthPanelXoffsetPanelYoffset );
TextCell"Text Message F"5colorWhite);
MsgCol_End();
_SECTION_END();

_SECTION_BEGIN("MESSAGE PANEL 3");
Newpanel();
CellHeight                Param("1Cell Height",20,5,200,1);
CellWidth                 Param("1Cell Width",120,5,200,1);
PanelYoffset             Param("1Cell Row Offset (px)",10,0,Status("pxheight"),1);
PanelXoffset            Param("1Cell Column Offset (px)",10,0,Status("pxwidth"),1);
FontRatio               Param("1Font:CellHeight ratio",2,1,20,0.1);

MsgCol_Begin"COLUMNNAME  1"CellHeightCellWidthPanelXoffsetPanelYoffset );
TextCell"PANEL 3"colorBlackcolorWhite);
TextCell"Text Message 22"23);
TextCell"Text Message 23"84);
TextCell"Text Message 24"75);
TextCell"Text Message 25"46);
TextCell"Text Message 26"37);
TextCell"Text Message 27"28);
MsgCol_End();

MsgCol_Begin"COLUMNNAME  2"CellHeightCellWidthPanelXoffsetPanelYoffset );
TextCell"Text Message 28"92);
TextCell"Text Message 29"83);
TextCell"Text Message 30"74);
TextCell"Text Message 31"65);
TextCell"Text Message 32"56);
TextCell"Text Message 33"47);
TextCell"Text Message 34"38);
MsgCol_End();
_SECTION_END();

Weekly High or Low Days

Candle-Stick Evaluation (v2)

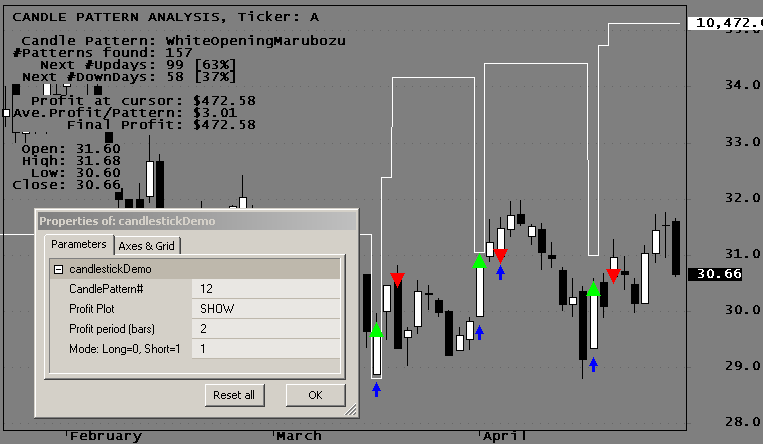
This indicator formula allows you to select Candlestick patterns, mark their occurrence on the chart, display their frequency, and test their predictive value. Apply the code to an Indicator, open up the Param window, and drag the CandlePattern# slider left and right to change to a different pattern. The selected pattern is identified in the chart Title text and graphically on your chart by a upwards pointing Blue arrow. The white line on your chart represents the resulting equity (“profit plot” in the Param window) for the pattern for the selected Profit Period. This line can be turned On or Off in the Param window. Entries (Buy or Short) are at the Close of the Pattern bar. Exits (Sell or Cover) are at the Open and can be delayed up to 10 bars with respect to the entry, as set in the Param window.

This code was originally written many years ago and was revised to take advantage of newer AFL functions. Also, code has been added to allow you to Backtest and Optimize to find the best pattern, delay, and trading mode. Note that trading mode “1” in the optimizer report indicates Long trades, a “0” indicates Short trades. Red Arrows are either Sell or Short, Green Arrows are either Buy or Cover, depending on your Mode selection. The chart below shows how typical CandlePatterns are identified:


Try different tickers; they will all behave differently. Only basic stats are provided in the chart Title, please add your own price patterns and metrics.

function ParamOptimizedescriptiondefaultValminvmaxvstep )
{
    return OptimizedescriptionParamdescriptiondefaultValminvmaxvstep ), minvmaxvstep );
}
 
O1 Ref(O,-1);O2 Ref(O,-2);  
H1 Ref(H,-1);H2 Ref(H,-2);  
L1 Ref(L,-1);L2 Ref(L,-2);  
C1 Ref(C,-1);C2 Ref(C,-2);  
function CandlePattern(P)  
{  
global PatternName;  
if(== 0) { PatternName "NearDoji"Pv = (abs(O-C)<= ((H-L)*0.1)); }  
else if(== 1) { PatternName "BlackCandle"Pv = (O>C); }  
else if(== 2) { PatternName "LongBlackCandle"Pv = (O>AND (O-C)/(.001+H-L)>.6); }  
else if(== 3) { PatternName "SmallBlackCandle"Pv = ((O>C) AND ((H-L)>(3*(O-C)))); }  
else if(== 4) { PatternName "WhiteCandle"Pv = (C>O); }  
else if(== 5) { PatternName "LongWhiteCandle"Pv = ((C>O) AND ((C-O)/(.001+H-L)>.6)); }  
else if(== 6) { PatternName "SmallWhiteCandle"Pv = ((C>O) AND ((H-L)>(3*(C-O)))); }  
else if(== 7) { PatternName "BlackMaubozu"Pv = (O>AND H==AND C==L); }  
else if(== 8) { PatternName "WhiteMaubozu"Pv = (C>AND H==AND O==L); }  
else if(== 9) { PatternName "BlackClosingMarubozu"Pv = (O>AND C==L); }  
else if(== 10) { PatternName "WhiteClosingMarubozu"Pv = (C>AND C==H); }  
else if(== 11) { PatternName "BlackOpeningMarubozu"Pv = (O>AND O==H); }  
else if(== 12) { PatternName "WhiteOpeningMarubozu"Pv = (C>AND O==L); }  
else if(== 13) { PatternName "HangingMan"Pv = (((H-L)>4*(O-C)) AND ((C-L)/(.001+H-L)>= 0.75) AND ((O-L)/(.001+H-L)>= 0.75)); }  
else if(== 14) { PatternName "Hammer"Pv = (((H-L)>3*(O-C)) AND ((C-L)/(.001+H-L)>0.6) AND ((O-L)/(.001+H-L)>0.6)); }  
else if(== 15) { PatternName "InvertedHammer"Pv = (((H-L)>3*(O-C)) AND ((H-C)/(.001+H-L)>0.6) AND ((H-O)/(.001+H-L)>0.6)); }  
else if(== 16) { PatternName "ShootingStar"Pv = (((H-L)>4*(O-C)) AND ((H-C)/(.001+H-L)>= 0.75) AND ((H-O)/(.001+H-L)>= 0.75)); }  
else if(== 17) { PatternName "BlackSpinningTop"Pv = ((O>C) AND ((H-L)>(3*(O-C))) AND (((H-O)/(.001+H-L))<.4) AND (((C-L)/(.001+H-L))<.4)); }  
else if(== 18) { PatternName "WhiteSpinningTop"Pv = ((C>O) AND ((H-L)>(3*(C-O))) AND (((H-C)/(.001+H-L))<.4) AND (((O-L)/(.001+H-L))<.4)); }  
else if(== 19) { PatternName "BearishAbandonedBaby"Pv = ((C1 == O1) AND (C2>O2) AND (O>C) AND (L1>H2) AND (L1>H)); }  
else if(== 20) { PatternName "BearishEveningDojiStar"Pv = ((C2>O2) AND ((C2-O2)/(.001+H2-L2)>.6) AND (C2<O1) AND (C1>O1) AND ((H1-L1)>(3*(C1-O1))) AND (O>C) AND (O<O1)); }  
else if(== 21) { PatternName "DarkCloudCover"Pv = (C1>O1 AND ((C1+O1)/2)>AND O>AND O>C1 AND C>O1 AND (O-C)/(.001+(H-L)>0.6)); }  
else if(== 22) { PatternName "BearishEngulfing"Pv = ((C1>O1) AND (O>C) AND (O>= C1) AND (O1>= C) AND ((O-C)>(C1-O1))); }  
else if(== 23) { PatternName "ThreeOutsideDownPattern"Pv = ((C2>O2) AND (O1>C1) AND (O1>= C2) AND (O2>= C1) AND ((O1-C1)>(C2-O2)) AND (O>C) AND (C<C1)); }  
else if(== 24) { PatternName "BullishAbandonedBaby"Pv = ((C1 == O1) AND (O2>C2) AND (C>O) AND (L2>H1) AND (L>H1)); }  
else if(== 25) { PatternName "BullishMorningDojiStar"Pv = ((O2>C2) AND ((O2-C2)/(.001+H2-L2)>.6) AND (C2>O1) AND (O1>C1) AND ((H1-L1)>(3*(C1-O1))) AND (C>O) AND (O>O1)); }  
else if(== 26) { PatternName "BullishEngulfing"Pv = ((O1>C1) AND (C>O) AND (C>= O1) AND (C1>= O) AND ((C-O)>(O1-C1))); }  
else if(== 27) { PatternName "ThreeOutsideUpPattern"Pv = ((O2>C2) AND (C1>O1) AND (C1>= O2) AND (C2>= O1) AND ((C1-O1)>(O2-C2)) AND (C>O) AND (C>C1)); }  
else if(== 28) { PatternName "BullishHarami"Pv = ((O1>C1) AND (C>O) AND (C<= O1) AND (C1<= O) AND ((C-O)<(O1-C1))); }  
else if(== 29) { PatternName "ThreeInsideUpPattern"Pv = ((O2>C2) AND (C1>O1) AND (C1<= O2) AND (C2<= O1) AND ((C1-O1)<(O2-C2)) AND (C>O) AND (C>C1) AND (O>O1)); }  
else if(== 30) { PatternName "PiercingLine"Pv = ((C1<O1) AND (((O1+C1)/2)<C) AND (O<C) AND (O<C1) AND (C<O1) AND ((C-O)/(.001+(H-L))>0.6)); }  
else if(== 31) { PatternName "BearishHarami"Pv = ((C1>O1) AND (O>C) AND (O<= C1) AND (O1<= C) AND ((O-C)<(C1-O1))); }  
else if(== 32) { PatternName "ThreeInsideDownPattern"Pv = ((C2>O2) AND (O1>C1) AND (O1<= C2) AND (O2<= C1) AND ((O1-C1)<(C2-O2)) AND (O>C) AND (C<C1) AND (O<O1)); }  
else if(== 33) { PatternName "ThreeWhiteSoldiers"Pv = (C>O*1.01) AND (C1>O1*1.01) AND (C2>O2*1.01) AND (C>C1) AND (C1>C2) AND (O<C1) AND (O>O1) AND (O1<C2) AND (O1>O2) AND (((H-C)/(H-L))<.2) AND (((H1-C1)/(H1-L1))<.2) AND (((H2-C2)/(H2-L2))<.2); }  
else if(== 34) { PatternName "DarkCloudCover"Pv = (C1>O1*1.01) AND (O>C) AND (O>H1) AND (C>O1) AND (((C1+O1)/2)>C) AND (C>O1) AND (MA(C,13)-Ref(MA(C,13),-4)>0); }  
else if(== 35) { PatternName "ThreeBlackCrows"Pv = (O>C*1.01) AND (O1>C1*1.01) AND (O2>C2*1.01) AND (C<C1) AND (C1<C2) AND (O>C1) AND (O<O1) AND (O1>C2) AND (O1<O2) AND (((C-L)/(H-L))<.2) AND (((C1-L1)/(H1-L1))<.2) AND (((C2-L2)/(H2-L2))<.2); }  
else if(== 36) { PatternName "doji"Pv = (== C); }  
else if(== 37) { PatternName "GapUp"Pv GapUp(); }  
else if(== 38) { PatternName "GapDown"Pv GapDown(); }  
else if(== 39) { PatternName "BigGapUp"Pv L>1.01*H1; }  
else if(== 40) { PatternName "BigGapDown"Pv H<0.99*L1; }  
else if(== 41) { PatternName "HugeGapUp"Pv L>1.02*H1; }  
else if(== 42) { PatternName "HugeGapDown"Pv H<0.98*L1; }  
else if(== 43) { PatternName "DoubleGapUp"Pv GapUp() AND Ref(GapUp(),-1); }  
else if(== 44) { PatternName "DoubleGapDown"Pv GapDown() AND Ref(GapDown(),-1); }  
return Pv;  
}  
SetTradeDelays(0,0,0,0);
SetOption("AllowSameBarExit",False);
 
 
ParamOptimize("CandlePattern#",20,0,44,1);
PlotProfit ParamToggle("Profit Plot","HIDE|SHOW",0);  
PP paramOptimize("Profit period (bars)",1,1,10,1);  
CandlePatternTrue CandlePattern(P);  
Mode Paramoptimize("Mode: Long=0, Short=1",1,0,1,1);

if ( Mode == )
{
    Short Cover 0;
    Buy CandlePatternTrue;
    BuyPrice C;
    Sell RefBuy, -PP );
    SellPrice O;
}
else
{
    Buy Sell 0;
    Short CandlePatternTrue;
    ShortPrice C;
    Cover RefShort, -PP );
    CoverPrice O;
}
 
E                 Equity(1);
Profit         E-GetOption("InitialEquity");  
Upday         IIf(Ref(CandlePatternTrue,-1), C>O,0);  
downDay         IIf(Ref(CandlePatternTrue,-1), C<O,0);  
PatternColorIIf(CandlePatternTrue,2,1);  
NumUpDays     LastValue(Cum(UpDay));  
NumDownDays LastValue(Cum(downDay));  
NumPatterns LastValue(Cum(CandlePatternTrue ));  
 
GraphXSpace 10;
Plot(C,"Close",colorBlack,64);  
if( PlotProfit Plot(E,"",2,styleStaircase|styleOwnScale);  
Pointer IIfCandlePatternTrue0.97*L,0);
//PlotOHLC(0,0,Pointer ,0,"",6,styleCloud|styleNoLabel);
PlotShapesIIf(Pointer,shapeUpArrow,shapeNone),colorBlue,0,0.99*L,0);  
PlotShapes(IIf(Buy OR Cover,shapeUpTriangle,shapeNone),colorBrightGreen,0,C,0);  
PlotShapes(IIf(Sell OR Short,shapeDownTriangle,shapeNone),colorRed,0,O,0);
 
Title "\nCANDLE PATTERN ANALYSIS, Ticker: "Name()+"\n\n"+  
" Candle Pattern: "+PatternName+"\n"+
"#Patterns found: "+NumToStr(NumPatterns ,1.0)+"\n"+  
"   Next #Updays: "+NumToStr(NumUpDays,1.0,False)+  
" ["+NumToStr(Nz(NumUpDays/NumPatterns*100),1.0,False)+"%]\n"+  
" Next #DownDays: "+NumToStr(NumDownDays,1.0,False)+  
" ["+NumToStr(Nz(NumDownDays/numpatterns*100),1.0,False)+"%]\n\n"+  
"  Profit at cursor: $"+NumToStr(Profit,1.2)+"\n"+  
"Ave.Profit/Pattern: $"+NumToStr(Nz(Profit/NumPatterns),1.2)+"\n"+  
"      Final Profit: $"+NumToStr(LastValue(Profit),1.2)+"\n\n"+
" Open: "+NumToStr(O,1.2)+"\n"+  
" High: "+NumToStr(H,1.2)+"\n"+  
"  Low: "+NumToStr(L,1.2)+"\n"+  
"Close: "+NumToStr(C,1.2);  

Edited by Al Venosa.

Introduction to Real-Time Control-Panels

IMPORTANT NOTES:

1) Posts in this category are published as code is developed and you should use the most recent version posted. This code is shared without extensive field testing and may contain errors or function different than you expect. Always verify that the code does what you want it to do before using it in a real application. This publishing method is used to give you a chance to use it at the current stage of development, else you would have to wait until all functions are completed – and that time might never come :-)

2) All code on the UKB takes advantage of the latest AFL functions. If you encounter problems, and before posting questions, please verify that you are running the latest AmiBroker beta software. New releases are usually announced in the AmiBroker Development Log. The code you find here is modified too frequently to add/maintain version() statements to/in all programs published.

3) The code covered in this series of posts make extensive use of GFX functions please read the posts in the GFX Programming category.

==========

In Real-Time trading it is handy to use "Control Panels". Control Panels are custom button layouts that can be used to change system settings, and give Real-Time visual feedback on the state of the system. Clicking any of the buttons lets you execute specific code with a single mouse click. While the AmiBroker Parameter window is very useful for use with Indicators it lacks important features needed in Real-Time. Posts in this category will cover the development of a custom menu system for use in Real-Time applications. It will offer: relocatable and collapsible menus, dynamic coloring, multi-state toggles, dynamic labels, sizable buttons and fonts, status indicators, unlimited menu columns, etc. Of course you can conceive and add your own special functions. The main code can be placed in an Include file and menus and buttons can be added to your code with statements somewhat similar to the AmiBroker Param(). The code below generates the first column for the test menu shown in the image below the code.

Menu_Begin( &quot;MENUS&quot;, ButtonHeightButtonWidthMenuXoffsetMenuYoffset );       
MenuMinimized MenuHeaderBLUWHT);        
ExpandAll MenuTrigger( &quot;EXPAND ALL&quot;, ColorTriggerColorTriggerOnBLK );        
SaveMenus MenuTrigger( &quot;SAVE&quot;, ColorTriggerColorTriggerOnBLK );        
LoadMenus MenuTrigger( &quot;LOAD&quot;, ColorTriggerColorTriggerOnBLK );        
MovingMenu ButtonRotate( &quot;MOVING,DRAG MENU&quot;, &quot;4,1&quot;, &quot;7,2&quot;);       
Menu_End();</p>

A Rotate button changes state with each click. It can function as a ParamToggle() but can also be used to rotate through multiple states like Buy, Sell, Short, and Cover just by clicking the button multiple times. Each click can change the Button label and color. Here is a typical menu layout:

image

Menus can be collapsed by Double-Clicking on any of the Blue headers. This means you can uncover hidden chart sections instantly, without having to move the menu block. In its collapsed state the menu looks like this:

image

You can also collapse individual menus with a single click on the blue header, as shown below.

image

Posts in this series will progress through various prerequisites and building blocks to help you design your own menu layout.

Data Resources – Australia

A list of unqualified data resources for the Australian market including EOD, Snapshot, Intra-day and Real Time data for Equities, Commodities, Forex and other instruments (some sites do provide data for the United States and International Markets that might interest international readers).

This is an unofficial resource guide. For a complete list of AmiBroker supported data providers refer to: http://www.amibroker.com/guide/h_quotes.html

The list is dynamic and subject to change without notice. It is ordered according to when the author researched the site and it is not sorted by rank or order of merit.

NOTE : MOST OF THE LINKS CONTAIN COMMERCIAL REFERENCES OR LINK TO COMMERCIAL SITES.

THE AUTHOR HAS NO COMMERCIAL AFFILIATIONS OF ANY KIND AND RECEIVES NO GRATUITIES, OR BENEFITS, FROM ANY COMMERCIAL ORGANIZATION OR INDIVIDUAL INVOLVED IN COMMERCIAL ACTIVITIES. NOR IS HE PERSONALLY ENGAGED IN ANY COMMERCIAL ACTIVITIES, RELATED TO TRADING, IN ANY WAY. THE LINKS ARE PROVIDED AS A RESOURCE AND FOR EDUCATIONAL PURPOSES. THEY ARE NOT A RECOMMENDATION, ON THE PART OF THE AUTHOR, NOR DO THEY CONSTITUTE INVESTMENT ADVICE AND SHOULD NOT BE CONSTRUED AS SUCH.

THE AUSTRALIAN STOCK EXCHANGE

http://www.asx.com.au/index.htm

The Australian Securities Exchange (ASX) has over 60 information vendors who distribute a wide range of market information from the Australian Securities Exchange and Sydney Futures Exchange trading platforms.

The ASX Information Vendors Guide contains details of the products and services offered by these vendors, together with contact information and links to their websites. Link to the Information Vendors page http://www.asx.com.au/resources/information_services/index.htm to download the Vendors Guide in PDF format or search the ASX site for "Data Vendors".


DISCUSSION

For a discussion on ASX feeds refer to the AmiBrokerYahoo MessageBoard – message # 119228 – "best feed for ASX":

http://finance.groups.yahoo.com/group/amibroker/message/119228

For additional discussion, especially on the AmiBroker supported providers, search the board using the providers name as the "message body contains" criteria.


DATA VENDORS

This section summarizes the main products and services of a few of the official ASX Information Vendors. It does not include information on all products and services or all companies. Interested readers should search further by following the links to vendor sites from the Vendors Guide.

The listed providers meet one or more of the following criteria:

  • a) they are AmiBroker supported data vendors,
  • b) they are well established companies, or,
  • c) they are distinguished by a unique product or service e.g. a price advantage or hard to find data.

9) Norgate Investor Services

http://www.premiumdata.net/

Norgate is an AmiBroker supported EOD data provider of a wide range of instruments and markets.

http://www.premiumdata.net/products/datatools/price.php

a) Stock market EOD data downloaded using Premium Data:

"Quality end-of-day data for stock markets in Australia (ASX), Asia (SGX) and USA (AMEX, NASDAQ, NYSE, OTC-BB, PinkSheets). Extensive historical data is available. Hourly snapshot data is available for the ASX and SGX. Data is provided in MetaStock data format.

Stock data is organised into security types (equities, indices, warrants, options) and can be organised into custom folders which allow you to segregate listings into categories such as index participation, sector, industry group, dividend-paying-shares. World Indices are provided free with any subscription".

Australia: http://www.premiumdata.net/products/premiumdata/asxlayout.php

Singapore: http://www.premiumdata.net/products/premiumdata/sgxlayout.php

United States: http://www.premiumdata.net/products/premiumdata/uslayout.php

World Indices: http://www.premiumdata.net/products/premiumdata/worldindiceslayout.php

b) Futures market EOD data downloaded using DataTools:

"Data is also provided for 86 highly liquid futures markets in Australia (SFE), Asia (HKEX, KSE, SGX), Canada (Mx, WCE), Europe (Eurex, ICE Futures Europe, LIFFE) and the US (CBOT, CME, COMEX, KCBT, NYMEX, ICE Futures US). Coverage includes precious metals, currencies, indexes, interest rates, bonds, energy commodities, agricultural commodities. Futures data is available in individual, spliced continuous and back-adjusted continuous contract forms and extensive historical data is available. Data is provided in ASCII and MetaStock data formats":

http://www.premiumdata.net/products/datatools/futures-coverage.php

c) Foreign exchange EOD data downloaded using Premium Forex:

"Foreign Exchange (FOREX) data covers 82 currency pairs on an end-of-day basis. Data is provided in ASCII and MetaStock data formats. Extensive historical currency data back to 1991 is available":

 http://www.premiumdata.net/products/forex/coverage.php

A free fully functional six month trial is available for all of the supported markets comprising six months historical data plus three weeks of daily updates. 

Norgate Investor Services data is well integrated with AmiBroker: http://www.premiumdata.net/support/amibroker.php

8) Interactive Brokers

http://www.interactivebrokers.com/ibg/main.php

Interactive Brokers (IB) is an AmiBroker supported trading platform: http://www.amibroker.com/ib.html

The interface to the IB server is via Trader Work Station (TWS), a Java-based application.

"Trade over 70 market centers worldwide in a single IB Universal Account covering options, ETF, warrants, futures, forex,stocks and bonds etc".

IB also operates branches in Canada and the UK and maintains some foreign language sites:

http://individuals.interactivebrokers.com/en/ibglobal_sites.php?ib_entity=llc

Non-US residents are accepted as account holders in the US.

RT data is bundled with TWS, prices depending on trading activity and the exchanges traded.

http://individuals.interactivebrokers.com/en/accounts/fees/marketData.php?ib_entity=llc

Australia is included in the Asian Region (mandatory exchange fees apply).

Note: click on the Asian tab at the link above to view the Asian Region details.

IB is enabled for automated trading:

"APIs allow traders to develop sophisticated algorithmic trading solutions using Java, C++, VB or ActiveX, which take advantage of IB’s high speed order routing functionality and broad market depth. IB also supports the industry-standard FIX protocol for clients who connect via our CTCI (computer-to-computer interface)".


7) Quote Tracker

QuoteTracker is an AmiBroker supported provider of budget priced Real Time data.

http://www.amibroker.com/qtracker.html

"QuoteTracker is a Windows program that integrates with various data-feeds, brokers and financial sites to provide you with streaming real-time quotes. It also ties into major brokers to give you full Integrated trading from within the software".

It is available for free, as ad sponsored software, or as a paid registered version.

Data is accessed from Quote Tracker by AmiBroker via a dedicated plug-in.

A wide range of instruments are supported (Stocks, Options, Indices, Futures, FOREX/Currencies, Bonds, etc) depending on the data-feed provider.

Historical data is available for up to 60 days for the paid version or not available/limited for the ‘free’ version, once again depending on the provider and the type of data used (historical tick data is time limited compared to minute data).

Several sources of ASX data are included in the approved providers list, including some popular brokers:

http://www.quotetracker.com/qsources.shtml


6) PhoenixAI

Unlimited Real Time All The Time equities and options data for the ASX. Time limited and symbol limited plans are also available.

World currencies from Reuters is an optional extra.

https://secure.phoenixai.com.au/pai/main/Plans.php

AmiBroker connection is via a DDE link only (no backfill).

One year of historical data can be manually exported, as text, on a symbol by symbol basis. (EOD or Intraday or both????)

The first months subscription is heavily discounted for new users.

To subscribe to the first month at discounted rates:

  • a) Click on Activate from the PhoenixAI Home Page side bar.
  • b) Select No (I do not have an activation code).
  • c) Fill in your personal details (a valid credit card is required).
  • d) Proceed with the subscription (an activation code will be provided and a credit for the first month will be included in the final invoice).
  • e) Print the account details etc before closing out (registration details will be emailed immediately).

Note: Carefully record the details and your start date. If you are unhappy with the product or service notify support[at]phoenixai.com.au to close the account within 21 days of the initial subscription and no further charges will accrue above and beyond the first months discounted fee.


5) eSignal

http://www.esignal.com/

eSignal is an AmiBroker supported provider.

http://www.amibroker.com/esignal.html

The available packages include Real Time and EOD data for for multiple markets and instruments.

http://www.esignal.com/esignal/matrix/matrix_data.asp

EOD data is adjusted for splits but not dividends.

Their software includes DDE compatibility and data export features.

Data for the ASX is available with all eSignal subscriptions (eSignal Premier/Premier Plus/EOD) as an inclusion in the Asia/Pacific Region module.

Note: eSignal does not have access to ASX Exchange Traded Options and they are not included in the eSignal Premier Plus options package.

The pricing structure comprises a one-off licence, or base fee, plus an additional fee for nominated exchanges (the exchange fee is mandatory as it is imposed on the providers by the exchanges). This has advantages for Australian users who follow more than one market, or trade various instruments e.g. the US equities exchanges can be added to the base subscription as a second market for a small additional fee).

http://www.esignal.com/esignal/pricing/exchcalc.asp

Historical data is available for all subscriptions.

Category Daily Intraday/Interval2 Tick
North American Stocks 15 + Years 120 Days 10 Days
North American Futures Varies by Contract, as much as 9 years1 120 Days 10 Days
North American Options Up to 1 year (database initiated 11/3) n/a n/a
North American Indices 10 + Years 120 Days 10 Days
Mutual Funds/Money Markets 10 + Years n/a n/a
European Equities and Indices 5 – 10 + Years 60 Days 10 Days
Asia Pacific Equities and Indices 2 – 5 + Years 60 Days 10 Days
European/Asia Pacific Futures Varies by Contract, as much as 9 years1 120 Days 10 Days
Forex (bid/ask data only) 20 + Years on major issues 120 Days 10 Days
GovPx Treasuries 6 months 120 Days 10 Days

eSignal overs new customers a 30 day trial period:

http://www.esignal.com/esignal/specials/default.asp#30day

For additional information refer to the eSignal Knowledge Base:

Note: Clicking on Support >> Customer Support at the eSignal Home Page will take readers to the Support Page where there is a second Support button (referred to in ‘b’ above).

To refer to an alphabetical list of Australian symbols:

  • a) Go to the Knowledge Base.
  • b) Click on the Show Nav icon to open a KB Index in the left-hand sidebar.
  • b) Pick Symbols Guide from the index, and select article #2739 Symbol Directory and Reference List (the directory page will open).
  • c) Open article #2737 Asian/Pacific Stocks from a link near the top of the Symbol directory (the link is included under the Europe / Africa / Asia / South America / Pacific Stocks and Indices heading).
  • d) Click on the link near the top of the page that leads to Asia / Pacific A to Z Stock Symbol Listing (this opens an indexed list of alphabetically sorted symbols in their regional groupings).
  • e) Scroll down to the Australian section of the Asian/Pacific Region.

A short cut to the Symbol Directory is attached: http://www.dbc.com/SymbolLookup/International/Top/inter.htx?source=blq/dbc_trading#Asian.


4) Weblink

http://www.weblink.com.au/

Historical tick data for ASX equities (7 years) and indices (6 months) in CSV format.  Available as daily files. Historical data is shipped on CD and daily updates are by download.


Q. Can I obtain a sample of the data?

A. Yes, a small typical file is available via email.


Q. Is the data raw or filtered ticks?

It is raw tick data.  Any wrong ticks are corrected by the ASX with a cancel.   The file includes  the cancels. We don’t make that decision – the ASX does.


Q. Can I order online?

A. No, orders are only accepted by phone, fax or email.


Q. Is the data in individual files or one large file?

It is one file per day, as per the sample, with all traded stocks included.


Q. How big are the files?

A. They are only text files so they are only megabytes of data – not gigabytes.


Q. How will they be delivered?

The historical data is too large for download and will be shipped by CD. For the daily updates we will provide a user ID and a password to a web-site where you can download the files. You will have access to a CSV file and a zip version as well, for a smaller download.


Q. Do you have historical tick data for only the index (ASX200 or the All Ordinaries) component stocks?

A. Sorry we don’t have a product for this.


3) Cooltrader

http://www.cooltrader.com.au/

Inexpensive EOD data for the ASX, in daily Metastock or Comma Separated Value (CSV) files, delivered after hours. Fully adjusted for corporate events. Free access to end of day data at 10.00 am on the following day.

Historical data delivered on CD at a reasonable price (from 1992, format as above, de-listed stocks removed, indices back to the commencement of GIC’s sectors, including warrants and company traded options but excluding Exchange Traded Options).


2) Paritech

http://www.paritech.com.au/default-au.htm

Download after hours EOD data utilizing Paritech’s DataDirector software for one or multiple world markets:

  • Australian Stock Exchange (ASX)
    Sydney Futures Exchange (SFE)
    New York Stock Exchange (NYSE)
    National Association of Securities Dealers (NASDAQ)
    American Stock Exchange (AMEX)
    London Stock Exchange – Domestic
    Singapore Stock Exchange (SES)
    Overseas Indices, Foreign Exchange Rates and Futures

Format the output files to ASCII, Comma Separated Variable (CSV) or Metastock  and manage corporate actions (splits, name changes and additions) plus organize sectors (GIC’s) and favourites ( data is not dividend adjusted).

Historical data CD’s, with Data Director included, are available for all the supported markets (free with a subscription package):

  • ASX history is typically 14-16 years, plus many of the blue chip stocks and indices go back over 25 years,
  • Australian ETO’s (Exchange Traded Options) and Warrants,
  • the United States (NYSE, NASDAQ, Amex), Europe (LSE) and Singapore (SSX) markets going back over all securities approximately 10 years.

http://www.paritech.com.au/AU/products/data/renewal.asp

Note: US historical data is raw data (not adjusted in anyway).

Additional products available from Paritech:

a) COT (Commitment of Traders Reports) historical databases.

http://www.paritech.com.au/AU/products/data/cotdata.asp

http://www.paritech.com.au/AU/products/data/cotdata-history.asp

b) Unlimited real time data for the Australian markets using Paritech’s Pulse software, or via DDE functionality, that includes 50 time series live fields (no backfill or history). Exchange Traded Options are  included.

http://www.paritech.com.au/AU/products/data/pulse.asp

http://www.paritech.com.au/support/pulse/features/dde.asp

c) DataTools

EOD prices from the futures and spot markets worldwide, concentrating on the most liquid markets with 86 contracts in 13 different markets. Data Tools includes sophisticated mechanisms for the automatic creation of spliced continuous and back-adjusted continuous contracts, contract pricing and position sizing/risk management.

EOD data for Foreign Exchange – 13 spot cross-rates against the U.S. Dollar.

 http://www.paritech.com.au/AU/products/data/datatools.asp


1) JustData

 http://www.justdata.com.au/

EOD data for Forex, Stocks, Commodities and Futures from Australia, Asia, Europe, Africa, North and South America (stock market data from over 90 World Exchanges)

http://www.justdata.com.au/Products/BodhiFreeway/bg_data.htm#stocks

Download using JustData’s BodhiGold software in ASCII, CSV or Metastock formats or access free Yahoo data. The downloader filters and organizes stocks, as required, and also creates Indexes and Advance/Decline indicators.

ASX equity data package includes options, accurate dividend adjustment, GIC’s sector classification, de-listed stocks, bid/ask quotes and exportable current fundamental data. Choose to adjust your databases for Structural Events such as Share Splits; Distribution events such as Renounceable issues; Capital Change and Dividends.

Bodhi History includes expired symbols on the ASX since 1990 and on other Exchanges since JustData started disseminating them.

Note: most other equity markets are raw (unadjusted) data only.

Historical EOD data CD’s are available with data subscription packages or standalone. They include Equities, Indices, Income, Options, World Indices, Commodities & Forex for the major currencies (Australia, UnitedStates, Europe, Asia etc).

http://www.justdata.com.au/Products/BodhiHistory/index.htm

The future and commodity markets include continuous contracts and current contracts for all traded symbols. You can also adjust Overseas Future & Commodity data at the time of a contract swap.


Tracking Stock Changes (de-listings, name changes, events, adjustments etc).


A list of unqualified data resources for tracking stock changes (de-listings, name changes, new issues, acquisitions, events, adjustments etc), with a bias toward the American market.

This is an unofficial resource guide. For a complete list of AmiBroker supported data providers refer to: http://www.amibroker.com/guide/h_quotes.html

The list is dynamic and subject to change without notice. It is ordered according to when the author researched the site and it is not sorted by rank or order of merit.

NOTE : MOST OF THE LINKS CONTAIN COMMERCIAL REFERENCES OR LINK TO COMMERCIAL SITES.

THE AUTHOR HAS NO COMMERCIAL AFFILIATIONS OF ANY KIND AND RECEIVES NO GRATUITIES, OR BENEFITS, FROM ANY COMMERCIAL ORGANIZATION OR INDIVIDUAL INVOLVED IN COMMERCIAL ACTIVITIES. NOR IS HE PERSONALLY ENGAGED IN ANY COMMERCIAL ACTIVITIES, RELATED TO TRADING, IN ANY WAY. THE LINKS ARE PROVIDED AS A RESOURCE AND FOR EDUCATIONAL PURPOSES. THEY ARE NOT A RECOMMENDATION, ON THE PART OF THE AUTHOR, NOR DO THEY CONSTITUTE INVESTMENT ADVICE AND SHOULD NOT BE CONSTRUED AS SUCH.


8) Nasdaq

A list of historical component changes to the Nasdaq 100 is available from the Nasdaq home site.

http://www.nasdaq.com/indexshares/historical_data.stm

7) Stockcharts.com

Stockcharts.com maintains a searchable list of "all recent IPOs, stock splits, distributions, and dividends".

http://stockcharts.com/charts/adjusthist.html


6) JustData (Australia, USA, London, International ?)

a) Historical Databases

Metastock format databases, that include delisted stocks, going back over 10 years for the Australian Securities Exchange (ASX), New York Stock Exchange (NYSE), London Stock Exchange (LSE) etc.

Note: the quality varies.

BodhiGold downloader allows user selected adjustments to equity data (limited to the ASX only?):

http://www.justdata.com.au/Training/Tutorials/Features/history_adjustments.htm

It also includes the option to display expired symbols, name changes, events, fundamental information, and new issues.


b) Back Office Data

"JustData, in co-operation with Exchange Data International (EDI) have made available numerous Worldwide products……….including data for over 100 exchanges and thousands of securities e.g. Corporate Actions, Adjustment Factors, Dividends, Dividend Re-investment Plans, Closing Prices, Codefile (covers all Traded, Coded and Defunct securities listed on the LSE Domestic & International Markets), Sedol Tracker (designed to track changes to the static securities database maintained by the London Stock Exchange. There are normally around 500 to 1000 changed records issued per day), Public Holidays, Depositary Receipts, Shares Outstanding, Security Reference File (provides up-to-date information on almost 450,000 securities, including all securities currently traded on the London Stock Exchange’s domestic and international markets)".

http://www.justdata.com.au/Corporate/Funds/fund_products.htm#actions

An example of an adjustment factor file, for the NYSE, is available here:

http://www.justdata.com.au/Corporate/Funds/images/events_nys.txt


5) Commodity Services Inc (USA)

http://www.csidata.com/ua/pricing/index.html

Historical equity databases for US, and non-US, equities and indices (mainly the London and Toronto exchanges).

Note: De-listed stocks are only available with annual subscriptions and at an additional fee.


4) OTC Bulletin Board (USA)

A list of new issues, symbol and name changes, and deleted issues for OTCBB securities is available from this page.

http://www.otcbb.com/dailylist/


3) Zacks Professional Services (USA)

Historical equity databases for survivor and non-survivor companies, including price and fundamental data.

Analyst estimate databases that ‘avoid’ look-ahead bias.

http://nt3.zacks.com/default.htm


2) deListed (Australia)

http://www.delisted.com.au/aboutus.aspx

This website is published by deListed, a division of BRG Pacific Pty Limited (ABN 64 003 142 372), holder of Australian Financial Services Licence No: 264673.

deListed provides updates and information on failed companies including those in external administration and companies suspended from ASX, NZX, NSX and BSX. It also has all historical name changes and delistings for these exchanges and carries administrators/liquidators declarations for Australian companies for tax purposes.

Background

deListed and this website delisted.com.au were established by BRG director, Tony McLean, in response to problems experienced by shareholders when their investments turned sour. Tony was the Australian Shareholders’ Association’s CEO for nine years until the end of 2001. In that role he often assisted angry and frustrated shareholders in delisted companies. Having seen their investment fail, these shareholders were then left in the dark about the fate of their companies. Company directors denied responsibility and could not be found. Shareholders did not know who was responsible. They were unable to establish if there was any chance of a recovery. It was difficult to track down external administrators. Shareholders often waited years for a liquidator’s declaration. (The issue of this declaration is a Capital Gains Tax Event enabling the crystallisation of a capital loss for tax purposes.) Many shareholders never received this declaration or knew that it had been issued. The eventual launching of this website on 1 September 2002 had its genesis in a commitment to a group of ASA members in 1998, following a spate of requests for information.


1) Norgate Investor Services (Australia)

For subscribers to Australian Securities Exchange (ASX) EOD data, "de-listed securities are moved from the main database and maintained in a ‘De-listed Securities’ folder……..Separate de-listed stocks to enable you to develop trading strategies across the entire universe of stocks including those that have been delisted (includes all delisted stocks back to 1992)".

http://www.premiumdata.net/

« Previous Page