February 9, 2011
Collecting and Plotting Ticks v2
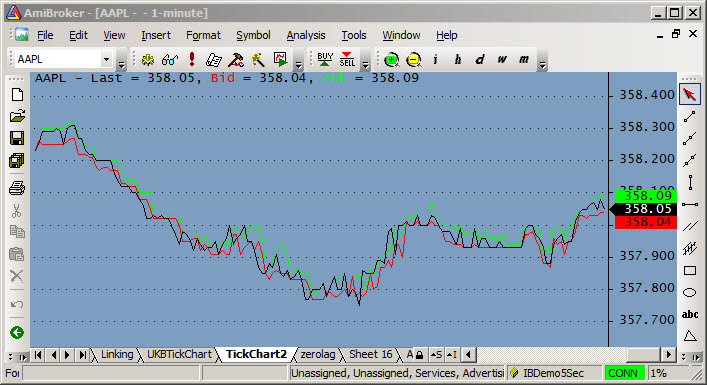
The program below shows how you can collect tick-based data and display it in its own pane.
Note: There was an error in the earlier version that is fixed, v2 only collect ticks if the Total Volume for the day changes. Feel free to report any further problems (on the main list or by private email please).
The example shows Last, Bid and Ask price. You can repeat the four lines that plot each price as often as you like to add other types of tick-based data. A typical chart looks like this:
function TickArray2( Ticker, TickPriceName, NumTicks, Reset )
{
Tickprice = GetRTDataForeign( TickPriceName, Ticker );
PrevVolume = Nz( StaticVarGet( "~TotalVolume_" + TickPriceName ) );
TotVol = GetRTDataForeign( "TotalVolume", Ticker );
StaticVarSet( "~TotalVolume_" + TickPriceName, TotVol );

if ( TotVol > PrevVolume )
{
InIndicator = Status( "Action" ) == 1;
StaticVarSet( "LastQuotePrice", TickPrice );
TA = Null;                                             // Clear Output array
NumTicks = Min( BarCount - 2, NumTicks ); // Stay in array size
for ( n = NumTicks; n >= 0; n-- )
{
T = StaticVarGet( TickPriceName + ( n - 1 ) );
StaticVarSet( TickPriceName + n, T );
TA[ BarCount - 1 - n] = T;     // Fill return array
}
StaticVarSet( TickPriceName + 0, TickPrice );
TA[BarCount-1] = TickPrice;
}
else
{
TA = Null;                                                // Clear Output array
NumTicks = Min( BarCount - 2, NumTicks );     // Stay in array size
for ( n = NumTicks; n >= 0; n-- )
{
T = StaticVarGet( TickPriceName + n );
TA[ BarCount - 1 - n] = T;     // Fill return array
}
}
return TA;
}

function TickArraysReset( TickPriceName )
{
global NumTicks;
StaticVarSet( "Init"+TickPricename, 1 );
for ( n = NumTicks; n >= 0; n-- ) StaticVarRemove( TickPriceName  + n );
}

GraphXSpace = 20;
TickerName = Name();
Clear        = ParamTrigger( "Clear Tick Charts", "CLEAR" );
NumTicks    = Param( "Tick-Array Length", 20, 3, 1000, 1 );

TickPriceName = "Last";
if ( IsNull( StaticVarGet( "Init"+TickPriceName ) ) OR Clear ) TickArraysReset( TickPriceName );
TA = TickArray2( TickerName, TickPriceName, NumTicks, Clear);
Plot( TA, TickPriceName, 1, 1);

TickPriceName = "Bid";
if ( IsNull( StaticVarGet( "Init"+TickPriceName ) ) OR Clear ) TickArraysReset( TickPriceName );
TA = TickArray2( TickerName, TickPriceName, NumTicks, Clear);
Plot( TA, TickPriceName, 4, 1);

TickPriceName = "Ask";
if ( IsNull( StaticVarGet( "Init"+TickPriceName ) ) OR Clear ) TickArraysReset( TickPriceName );
TA = TickArray2( TickerName, TickPriceName, NumTicks, Clear);
Plot( TA, TickPriceName, 5, 1);
 Filed by Herman at 11:04 am under Real-Time AFL Programming
Comments Off on Collecting and Plotting Ticks v2

