August 25, 2011
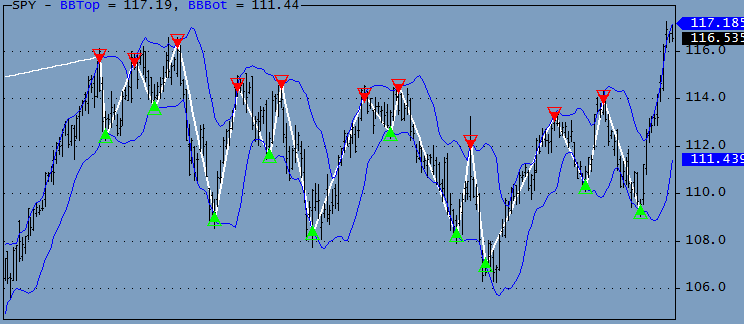
Bollinger Band ZigZag Indicator
IMPORTANT: Do not use the indicator in a real trading system; it looks ahead in time and will make you lose money. It is meant for research only: to show potential profits and display arrows at highly profitable positions to facilitate formulating better trading rules.
The indicator presented here is very similar to the ZigZag Indicator except that the turning points for this indicator are where the opposite Bollinger Bands are last breached before the next signal.
The formula is written as a trading system. It can be Backtested, and the BB period and width can be optimized. Since this is just an experimental formula no attempt has been made to optimize the code.

function ParamOptimize( description, defaultVal, minv, maxv, step )
    {
    return Optimize(description, Param(description,defaultVal, minv, maxv, step ), minv, maxv, step );
    }

BlankBars = 10; // Set to the number set in preferences

Buy = Sell = Short = Cover = Pos = 0;
Periods = ParamOptimize( "Periods", 3, 3, 30, 1 );
Width = ParamOptimize( "Width", 1, 0, 5, 0.1 );
BBTOp = BBandTop( H, Periods, Width ); // Note H is used instead of the tradional C
BBBot = BBandBot( L, Periods, Width ); // Note L is used instead of the tradional C

Plot( BBTop, "BBTop", colorBlue, styleLine );
Plot( BBBOt, "BBBot", colorBlue, styleLine );
Plot( C, "", 1, 128 );

BI = BarIndex();
start = Status( "firstvisiblebarindex" ) - BI[0] - BlankBars;
end     = Status( "lastvisiblebarindex" ) - BI[0] - BlankBars;
LBI = LastValue( BarIndex() );

for ( b = LBI; b > Periods; b-- )
{
    if ( L[b] <= BBBot[b] AND pos <= 0 )
    {
        pos = 1;
        Buy[b] = True;
        BuyPrice[b] = BBBot[b];
    }
    else
        if ( H[b] >= BBTop[b] AND Pos >= 0 )
        {
            Pos = -1;
            Sell[b] = True;
            SellPrice[b] = BBTop[b];
        }
}

Short = Sell;
ShortPrice = SellPrice;

Cover = Buy;
CoverPrice = BuyPrice;

Eq = Equity( 1 );

if ( ParamToggle( "Equity", "HIDE|SHOW", 0 ) )
    Plot( Eq, "", colorYellow, 1 | styleOwnScale );

ShowTriangles = ParamToggle( "Arrows", "HIDE|SHOW", 1 );

if ( showTriangles )
{
    PlotShapes( IIf( Buy,     shapeSmallUpTriangle, shapeNone ), 5, 0, BuyPrice, 0 );
    PlotShapes( IIf( Sell,    shapeHollowDownTriangle, shapeNone ), 4, 0, SellPrice, 0 );
    PlotShapes( IIf( Cover, shapeHollowUpTriangle, shapeNone ), 5, 0, CoverPrice, 0 );
    PlotShapes( IIf( Short, shapeSmallDownTriangle, shapeNone ), 4, 0, ShortPrice, 0 );
}

if ( ParamToggle( "Trade Lines", "HIDE|SHOW", 0 ) )
{
    Sig = Buy OR Short;
    signum = Cum( Sig );
    y0 = 0;
    y1 = C[0];
    TPrice = C;
    Shortcolor = LongColor = colorWhite;

    for ( b = start ;b < end ;b++ )
    {
        if ( Sig[b] )
        {
            x0 = y0;
            x1 = y1;
            y0 = b;

            if ( Buy[b] )
            {
                y1 = BuyPrice[b];
                Color = Shortcolor;
            }
            else
                if ( Short[b] )
                {
                    y1 = ShortPrice[b];
                    Color = Longcolor;
                }

            if( SigNum[b] > 1 ) Plot( LineArray( x0, x1, y0, y1 ), "", Color, 1 | styleThick );
        }
    }
}
 Filed by Herman at 8:43 pm under Indicators
Comments Off on Bollinger Band ZigZag Indicator
