A Real-Time Message FIFO

Real-time messages often appear on your screen only for the duration of a single chart-refresh interval and disappear before you have time to read them. The FIFO (First In First Out) n-line display presented here captures and scrolls messages in the chart Title so that they are easier to read. Logging messages to DebugView or the Interpretation window would require opening additional windows. Using the Title instead displays the messages right on the chart and is more space-efficient.

A typical application would be to display real-time system status, such as order status, TWS error messages, partial fills, account balance, profits, etc.

Since the chart Title does not support formatting, it is advisable to use a mono-spaced font, such as Lucida Console, and pad spaces to create columns. The integer part of the NumToStr() formatting parameter sets the overall length of the returned string and can be used to format columns. If you prefer more font and color options, you can use Gfx functions to display the messages.

To prevent Title wrapping, you can truncate messages using the StrLeft() function. This works well for TWS error messages that can be long but carry the important info at the left of the error message. The demo below uses a simple PadString() function to space short messages in columns.

The AddToFIFOTitle() function is called whenever you want to add a message to the table. Its first argument is the name of the static variable that contains the table, the second argument is the message you want to add to the table, and the third is the maximum number of lines in the table. Setting the third argument to zero clears the table.

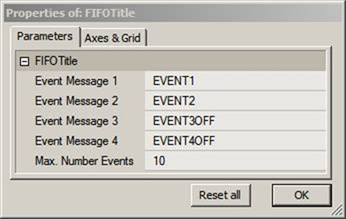
To keep things simple, the code below uses Param functions to simulate real-time messages; in a real system, these messages would be generated by real-time events. To test the code, click any of the numbered Event Messages in the Parameter window.

clip_image002

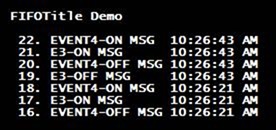
The Title produced should look like this:

clip_image004

Note that messages in this example are padded to position the next column properly. The order of the messages is inverted to allow the last message to appear at the top of the message table. Whenever the maximum number of lines is exceeded, the oldest message is removed. To ensure that the table is updated at least once a second you should always include a RequestTimedRefresh(1) in your code.

Finally, in Automated Trading you don’t always need charts, and you may prefer to display only a status table. Since the table is stored in a global Static Variable, you can read the table from any pane or window using just two lines of code:

RequestTimedRefresh);
Title "\n"+StaticVarGetText("FIFOTitle");

If you use several scrolling displays in different panes, you should key the Static Variables as explained in Keying Static Variables. The complete demo code follows:

function padStringStringColWidth )
{
SpaceFill " ";
if( String == "{EMPTY}" String "";
SL StrLen(String);
NS StrLeft(SpaceFillColWidth-SL);
return string+NS;
}

function AddToFIFOTitleStrNameStrMaxItems )
{
// Add New item
NewString "";
PrevStr StaticVarGetTextStrName );
ItemCount Nz(StaticVarGet("NumberItems"));
if( MaxItems == )
{
StaticVarSetText(StrName"");
StaticVarSet("NumberItems",0);
S1 "";
}
else if( Str != "" )
{
StaticVarSet("NumberItems",++ItemCount);
NewTitle NumToStr(ItemCount,3.0,False)+". "+Str "\n"PrevStr;
for(s=0n=0S1=""; ( s2=StrMid(NewTitle,s,1) ) != "" AND &ltMaxItemss++ )
{
S1 S1 S2;
if( S2=="\n" n++;
}
}
else S1 PrevStr// come here when Str == ""
StaticVarSetText(StrNameS1);
return StaticVarGetText(StrName);
}

RequestTimedRefresh);
// Simulate Transient (Trigger) Events
Event1 ParamTrigger("Event Message 1""EVENT1");
Event2 ParamTrigger("Event Message 2""EVENT2");
// Simulate State events and convert to triggers
PrevEvent3 Nz(StaticVarGet("Event3") );
Event3 ParamToggle("Event Message 3""EVENT3OFF|EVENT3ON",0);
StaticVarSet("Event3",Event3);
Event3Trigger Event3 != PrevEvent3;
PrevEvent4 Nz(StaticVarGet("Event4") );
Event4 ParamToggle("Event Message 4""EVENT4OFF|EVENT4ON",0);
StaticVarSet("Event4",Event4);
Event4Trigger Event4 != PrevEvent4 ;
MaxEvents Param("Max. Number Events",5,0,20,1);
if( Event1 )
{
Msg1 PadString"EVENT1 MSG"15)+Now(2);
AddToFIFOTitle"FIFOTitle"MSG1MaxEvents );
}
if( Event2 )
{
Msg2 PadString"EVENT2 MSG"15)+Now(2);
AddToFIFOTitle"FIFOTitle"Msg2MaxEvents );
}
if( Event3Trigger )
{
Msg3 PadStringWriteIf(Event3,"E3-ON MSG","E3-OFF MSG"), 15)+Now(2);
AddToFIFOTitle"FIFOTitle"Msg3MaxEvents );
}
if( Event4Trigger )
{
Msg4 PadString(WriteIf(Event4,"EVENT4-ON MSG","EVENT4-OFF MSG"), 15)+Now(2);
AddToFIFOTitle"FIFOTitle"Msg4MaxEvents );
}
Title "\nFIFOTitle Demo\n\n"+AddToFIFOTitle"FIFOTitle"""MaxEvents);

Edited by Al Venosa

Introduction to Real-Time System Design

Developing trading systems is a very personal activity, and opinions vary widely regarding what is the best approach. Most of the solutions presented here were developed by Herman van den Bergen. They may not be compatible with your personal preferences and you are encouraged to explore other alternatives more suited to your own trading style before deciding on a possible solution. To develop a Real-Time Automated Trading (RT/AT) system, you must have a trading system to automate. If you haven’t developed one yet, you may find some ideas in the Research and Exploration or Trading-Systems categories.

Modular design, readability, and simplicity of the system code are desirable to facilitate future maintenance. Posts in this category will progress through the various phases of developing a Real-Time Automated system.

Edited by Al Venosa

Introduction to Debugging AFL

Designing Automated-Trading systems can be complicated, and you can expect to spend a significant amount of time debugging your code. You will undoubtedly experience elusive problems that may be due to Internet delays, faulty data (such as low volume data spikes), orders that do not get processed, lack of volume, communication problems, etc. Such problems require you to know how to capture and display transient conditions, such as, for example, how orders are processed and acknowledged.

In real-time trading many events are not completed in a single AFL execution but in a sequence of small steps that are spread out over time and over many chart refreshes (AFL executions). This requires debugging techniques that are very different from EOD programming.

This category covers basic debugging techniques, such as: how to capture transient events, maintain a log, zero in on run-time bugs, display system variables, etc. Developing basic debugging techniques up front will save you significant time later.

Edited by Al venosa

Introduction to Real-Time Automated-Trading

Automated Trading of financial instruments is controversial and risky. Without exception, all code in this category is intended to demonstrate AFL programming techniques and not, under any circumstance, to place orders on your real-money trading account.

Code in this section has been developed using the latest versions of AmiBroker beta (4.96.0), the InteractiveBrokers Controller (1.1.1), and the TWS (873) as of this writing. If you experience execution problems, or AmiBroker gives you error messages, please verify that you are using the latest program versions before reporting bugs.

Unless stated otherwise, all programs are written to execute in an Indicator window. To run any of the examples, copy the code to the AFL editor and click Insert. To run programs that place orders on your paper trading or the eDemo account, the TWS must be open and connected to Interactive Brokers.

During initial testing, it is good practice to Insert the code in its own Pane under its own Chart-Tab, and activate only this window. This will prevent conflicts between static variables from different programs that may use the same name.

Most of the examples presented in this section are ready to copy, insert, and run. To give them this quality, peripheral code, like initializations, a trading system, and/or Title statement, had to be added. This makes the code a little longer but will give you a debugging start when applying the code and, at the same time, may expose you to some handy code snippets.

Edited by Al Venosa

Detecting Look-Ahead Problems

Look-ahead problems occur when, during Backtesting, your code uses future prices to calculate signals. When this happens, your system’s performance may be heavily inflated, but obviously since you are looking into the future, the system cannot be traded.

While the Indicator formula editor menu has a Check function, it often fails when debugging complex systems, especially if they use Plug-Ins or DLLs. Also, when it discovers a problem, it does not show you at which bar the problem occurred. The simple code presented here detects all look-ahead problems that might occur during a Backtest, even if your system uses Plugins or DLLs, and it can be appended to any system.

The code makes use of the fact that setting a future bar to NULL will cause dependent variables and signals to change. To use this technique your Arrows must be placed using the PlotShapes() function so that they will change when you NULL future bars. This would not happen if the arrows are placed by the Backtester. Thus, you should turn Off Arrows in your Param() menu.

To test for Look-Ahead problems, you should copy the code to your system formula and Apply it to an Indicator pane. Make sure your chart is fully right justified so that you can see the last bar, and zoom so that you can see some signal arrows. Next, open the Param window and move the slider to change the Remove Bars count. As you do this you will see bars disappearing, last bar first. When the disappearance of a bar causes a preceding arrow to disappear, your system looks ahead.

Note that this code can also be used to detect Indicator dependence on future bars. If your indicator changes ahead of your NULL bar, your Indicator is dependent on future data. When changes are very small, this may be hard to see. It would be an interesting coding challenge to save a number of bars and compare so that even small changes can be detected. Perhaps someone will write a DLL to do all this for us.

A minor drawback of this code is that you have to scan your chart manually, which may take a few minutes. You could add an automated scan and run the code using an exploration, generating an error table for an entire Watchlist. It wouldn’t be very fast, but it would increase the chance of detecting all possible errors.

The demo code below uses the Zig() function to place signals and arrows on the chart. Since Zig() looks ahead by varying amounts, it is perfect to demonstrate how this code works.

EnableNulling = ParamToggle("NULLing of Data","DISABLED|ENABLED",0);
RM = Param("NULL Bars L<-R",0,0,1000,1);
if( EnableNulling )
{
Z = Null;
LB = LastValue(BarIndex());
O = IIf(BarIndex()>(LB-RM),Z,O);
H = IIf(BarIndex()>(LB-RM),Z,H);
L = IIf(BarIndex()>(LB-RM),Z,L);
C = IIf(BarIndex()>(LB-RM),Z,C);
}
ZChange = Param("%Zig",0.1,0,1,0.05);
Z = Zig(C,ZChange);
Buy = Z < Ref(Z,1) AND Z < Ref(Z,-1);
Sell = Z > Ref(Z,1) AND Z > Ref(Z,-1);
Short = Sell;
Cover = Buy;
Plot(C,"",1,128);
PlotShapes(IIf(Buy, shapeSmallUpTriangle, shapeNone),5,0,BuyPrice,0);
PlotShapes(IIf(Sell, shapeHollowDownTriangle, shapeNone),4,0,SellPrice,0);
PlotShapes(IIf(Cover, shapeHollowUpTriangle, shapeNone),5,0,CoverPrice,0);
PlotShapes(IIf(Short, shapeSmallDownTriangle, shapeNone),4,0,ShortPrice,0);

Edited by Al Venosa

Time Calculations

Time calculations are needed when placing GAT (Good At Time) and GTD (Good Till Date) orders. The simplest way is to convert the TimeNum to a SecondNum, perform your calculations in Seconds, and then convert the SecondNum back to a TimeNum. The first two functions below will do that for you.

The next function applies a reference expressed in seconds to your Reference time. This reference would typically be used to Calculate GAT times. You may need this function when you want to apply an offset to a Time Reference and have orders activated automatically during the day without having to be online.

function TimeNumToSecondNumTimeNumber )
{
Seconds int(TimeNumber%100);
Minutes int(TimeNumber/100%100);
Hours int(TimeNumber/10000%100);
NumberSecs int(3600*Hours+60*Minutes+Seconds);
return NumberSecs;
function SecondNumToTimeNumSecondNum )
{
Hours int(SecondNum /3600);
Minutes int((SecondNum -Hours*3600)/60);
Seconds int((SecondNum -Hours*3600)-Minutes*60);
TimeNumber Hours*10000 Minutes*100 Seconds;
return TimeNumber;
}
function ApplyOffsetToTimeNumRefTimeNumberOffset )
{
OffsetSecondNum TimeNumToSecondNumRefTimeNumber ) + Offset;
OffsetTimeNumber SecondNumToTimeNumOffsetSecondNum );
return OffsetTimeNumber;
}
OffSet Param("Offset in Seconds",0,-100,100,1);
RefTimeNum ParamTime("ReferenceTime",Now(2));
CalcTimeNum ApplyOffsetToTimeNumRefTimeNumOffset );
Title ="\n"+
" Reference Time: "+StrRight(NumToStr(DateTimeConvert2DateNum(), RefTimeNum),formatDateTime),11)+"\n"+
"Calculated Time: "+StrRight(NumToStr(DateTimeConvert2DateNum(), CalcTimeNum ),formatDateTime),11)+"\n";

Edited by Al Venosa.

Date Calculations (v2)

In Real-Time trading, you may need to perform date calculations that are referenced to your computer date instead of to the DateNumber of your data. Instead of struggling with years, dates, and months, it is much easier to use a linear data system like Rata Die, which simply counts the number of days since December 31 of the year zero. To use the Rata Die method you only need two conversion functions to convert between the Rata Die to DateNumbers and vise versa. In this post the Rata Die system will be used to calculate NASDAQ non-trading days and to calculate the date of the previous trading day.

The conversion functions listed below were posted on the AmiBroker User list by Paul Ho (thanks Paul!) and will be used the perform the needed calculations in this post.

NASDAQ non-trading days are copied from the NASDAQ website, converted to DateNumbers, and entered into the code using a ParamStr() function so that they can be changed annually without digging in the code. Here is typical listing for 2007:

NASDAQ Holiday Trading Schedule
2007 Dates – Unless noted, the following dates are holidays on which The NASDAQ Stock Market is closed:
January 1 – New Year’s Day
January 15 – Martin Luther King Jr.’s Birthday
February 19 – Presidents’ Day
April 6 – Good Friday
May 28 – Memorial Day
July 4 – Independence Day
September 3 – Labor Day
November 22 – Thanksgiving Day
December 25 – Christmas Day

To find the previous trading date, the code starts by using the previous Rata Die date, and if that isn’t a trading date, it decrements the Rata Die number until a trading day is found. Selected variables are output to the Chart Title so that you can vary the date using the ParamDate() and see haw the conversions work..

function DateNumberToRataDie( DateNumber )
{
num = DateNumber/10000;
yyyy = int(num) + 1900;
num = frac(num) * 100;
mm = int(num);
dd = frac(num)*100;
yyyy = yyyy + int((mm-14)/12);
mm = IIf(mm < 3, mm+12, mm);
RataDieNum = round(dd + int((153*mm-457)/5) + 365*yyyy + int(yyyy/4) - int(yyyy/100) + int(yyyy/400) - 306);
return (RataDieNum);
}

function RataDieToDateNumber(RataDieNum)
{
z = RataDieNum + 306;
g = z - 0.25;
a = int(G/36524.25);
b = a - int(A/4);
yr = int((b + g)/365.25);
Cc = b + z - int(365.25 * yr);
mm = int((5 * Cc + 456)/153);
dd = Cc - int((153*mm-457)/5);
yr = IIf(mm > 12, yr + 1, yr);
mm = IIf(mm > 12, mm - 12, mm);
dn = (yr-1900)*10000+mm*100+dd;
return dn;
}

function NoTradingDay( RataDieNum )
{
global DN, NasdaqNTDN;
DN = RataDieToDateNumber(RataDieNum );
DnStr = NumToStr(DN,1.0,False);
DW = RataDieNum%7;
return DW == 0 OR DW == 6 OR StrFind( NasdaqNTDN, DNStr);
}

NasdaqNTDN = "1070101,1070115,1070219,1070406,1070528,1070704,1070903,1071122,1071225";
weekdays = "Sunday,Monday,Tuesday,Wednesday,Thursday,Friday,Saturday";
DN1 = ParamDate("Date","05/07/2007");
RD1 = DateNumberToRataDie(DN1);
DW1 = RD1%7;
RD2 = RD1-1;
DN2 = RataDieToDateNumber(RD2);
DW2 = RD2%7;
while( NoTradingDay( RD2 ) )
{
RD2--;
DN2 = RataDieToDateNumber(RD2);
DW2 = RD2%7;
}
Title = "\n"+
"CURRENT TRADING DAY:\n\n"+
" Date: "+NumToStr(DateTimeConvert( 2, DN1),formatDateTime)+" "+StrExtract(Weekdays,DW1)+"\n"+
" Day Number: "+NumToStr(DW1,1.0)+"\n"+
" Rata Die: "+NumToStr(RD1,1.0,False)+"\n"+
WriteIf(NoTradingDay( RD1 ),"This is Not a Trading Day","This is a Trading Day")+"\n\n\n"+
"PREVIOUS TRADING DAY:\n\n"+
" Prev TDay: "+NumToStr(DateTimeConvert( 2, DN2),formatDateTime)+" "+StrExtract(Weekdays,DW2)+"\n"+
" Day Number: "+NumToStr(RD2%7,1.0)+"\n"+
" Rata Die: "+NumToStr(RD2,1.0,False)+"\n"+
WriteIf(NoTradingDay( RD2 ),"This is Not a Trading Day", "This is a Trading Day");

Edited by Al Venosa

Bar-Scaling Tool

When testing short-term trading systems that respond to single-bar price changes it is very convenient to be able to manually change a bar’s price and force a signal. The small program listed below can be prefixed to your system’s code and will do this by magnifying the selected High, Low and Close price with respect to the Open price of the bar.

SetBarsRequired(100000,10000);
BI=BarIndex();
SB=LastValue(ValueWhen(BI==SelectedValue(BI),BI));
EnableScaling=ParamToggle("Bar Scaling","DISABLED|ENABLED");
ScalingFactor=Param("HLC Scaling Factor",1,0,5,0.01);
if(EnableScaling)
{
Hd=H[sb]-O[sb];
Ld=O[sb]-L[sb];
Cd=C[sb]-O[sb];
Hd=ScalingFactor*Hd;
Ld=ScalingFactor*Ld;
Cd=ScalingFactor*Cd;
H[sb]=O[sb]+Hd;
L[sb]=O[sb]-Ld;
C[sb]=O[sb]+Cd;
}
//Code to demonstrate bar scaling
Short=Cover=0;
Buy=Cross(High,Ref(H,-1));
Sell=Cross(Ref(L,-1),L);
BuyPrice=Ref(H,-1);
SellPrice=Ref(L,-1);
Plot(C,"",1,128);
PlotShapes(IIf(Buy,shapeUpTriangle,shapeNone),colorBrightGreen,0,BuyPrice,0);
PlotShapes(IIf(Sell,shapeDownTriangle,shapeNone),colorRed,0,SellPrice,0);

Edited by Al Venosa

Introduction to Real-Time AFL Programming

The AFL examples presented in this Category offer quick-start solutions to help get beginners on their way to Real-Time AFL programming. Topics will include measuring time, executing delays, collecting real-time data, scanning stocks, collecting order status, detecting errors, displaying system and portfolio status, etc. Most of the code may be related to fast automated trading, but much of it can also be used in other forms of trading.

They are not intended to replace or be a substitute for official AmiBroker documentation such as the AFL Reference, ReadMe files in your AmiBroker Folder, Knowledge Base, AFL Library, official Video Tutorials, and other Support material.

The objective is to create a resource of basic examples that introduce you to AFL programming techniques that you can easily modify to meet your personal needs. If you are a beginner or even if you are an ardent system developer, a well-organized resource like this can save you many hours of programming and make system development a lot more fun.

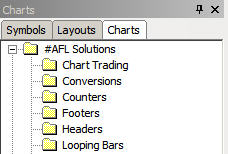
If you like to use Drag and Drop, you can create a #AFL Solutions folder (the “#” is added to force this folder to the top of your tree) in your C:\Program Files\AmiBroker\Formulas folder using the Windows Explorer. When you return to AmiBroker, you need to click View -> Refresh All to make the new folder visible. Inside the #AFL Solutions folder you can create sub folders to meet your specific requirements.

If you discover a useful AFL solution, you should copy it to the appropriate sub-folder of your #AFL Solutions folder. This will give you an impressive coding resource in just a few short weeks. A typical layout might look like this:

snag-0774.jpg


If you adopt standard-naming conventions for your variables, many of your code modules will work together without too many changes. Eventually you’ll be able to build trading systems in minutes instead of hours, simply by Dragging-and-Dropping code modules into an Indicator or perhaps by using the AFL Code Wizard.

Edited by Al Venosa.

Resetting Indicators

Smoothing Indicators like MA(), EMA(), T3(), DEMA(), etc. are intended to give you an average indication of price movements. They do this by filtering out high frequency changes in a particular price variable. The problem is that such indicators introduce time lag into the system. Indicator lag is most readily apparent when the overall price chart is relatively smooth (for example, when a simple MA() stays within the High-Low range), and suddenly the price shifts or gaps. When this happens, most smoothing indicators need many bars to overcome the influence of these gaps and re-position themselves back within the average price range of the bar.

Although all trading systems depend on lag to know that something has changed, the degree of lag needed by a system varies. Resettable indicators are most useful in systems that require a smoothing function that closely follows the price, i.e., one that exhibits a minimum of lag.

When a Resettable Indicator encounters a sudden larger-than-normal offset to the average price, it changes behavior and resets the Indicator to a calculated reference point. While there are other patterns or conditions (Signals, Stops, Targets, etc.) in which you might want to reset an Indicator, this discussion focuses on simple gaps that are defined by the AFL functions GapUp() and GapDown(). The techniques introduced here work equally well with EOD or RT data. Another application of the concept would be in RT trading where you might want to reset your Indicator at the start of each new day or trading session.

The reset idea is based on the fact that smoothing functions have a primary period and that the Indicator’s lag will be proportional to that period, i.e. longer periods increase lag and shorter periods decrease lag. Knowing that, we can reset an Indicator by simply setting its period to a lower value. Typically, resetting to a period of 1 works fine. After the reset bar, the period is increased with each passing bar until it has reached its original value.

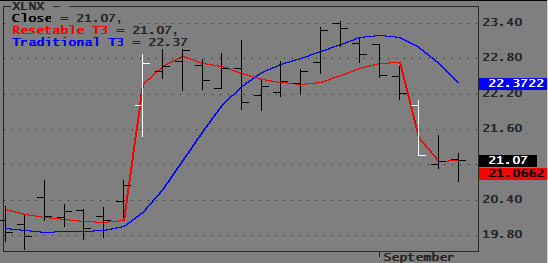
Consider the EOD example shown below. White bars identify the Gaps that trigger a reset.

snag-0773.jpg

At the first White bar the price gaps up and the Traditional T3 (Blue) falls behind immediately and actually moves opposite to the price. The Resettable T3 (Red) reset itself when it detected the gap and almost immediately is able to track the price bars in the right direction.

There are many ways to reset an indicator: you can do it abruptly by setting the period to 1; you can maintain a minimum smoothing by resetting it to 2 or 3; or you can gradually adjust period and/or T3-Sensitivity according to some formula. The example code below uses the T3 formula that can be found in the AmiBroker library.

In the example below, I use the start (1st bar) of the trading day to reset the T3. However, there are many other situations where you might want to reset an indicator. For example, when using trailing stops or SAR type exits, sometimes you might want to reset an indicator when you get a Buy or Sell signal. You can assign your own reset reference by averaging all bar prices, e.g., (O+H+L+C)/4. However, you should stay away from averaged values as they would reintroduce lag. I prefer the use of (O+C)/2, but you should try any number of other ideas that fit your liking.

function T3( Price, T3Periods, s )
{
e1 = AMA( Price, 2 / (T3Periods+1));
e2 = AMA( e1, 2 / (T3Periods+1));
e3 = AMA( e2, 2 / (T3Periods+1));
e4 = AMA( e3, 2 / (T3Periods+1));
e5 = AMA( e4, 2 / (T3Periods+1));
e6 = AMA( e5, 2 / (T3Periods+1));
C1 = -s^3;
C2 = 3*s^2*(1+s);
C3 = -3*s*(s+1)^2;
C4 = (1+s)^3;
T3Result= c1*e6+c2*e5+c3*e4+c4*e3;
return T3Result;
}


function T3r( C, T3Sensitivity, T3Periods, ResetReference )
{
global Reset;
CPrice = IIf(Reset, ResetReference, C );
T3Periods = Min( T3Periods, BarsSince(Reset));
T3Periods = IIf(Reset,1, T3Periods );
s = T3Sensitivity;
e1 = AMA( CPrice, 2 / (T3Periods+1));
e2 = AMA( e1, 2 / (T3Periods+1));
e3 = AMA( e2, 2 / (T3Periods+1));
e4 = AMA( e3, 2 / (T3Periods+1));
e5 = AMA( e4, 2 / (T3Periods+1));
e6 = AMA( e5, 2 / (T3Periods+1));
C1 = -s^3;
C2 = 3*s^2*(1+s);
C3 = -3*s*(s+1)^2;
C4 = (1+s)^3;
T3Result= c1*e6+c2*e5+c3*e4+c4*e3;
return T3Result;
}

T3Sensitivity = Param("T3 Sensitivity",1,0.1,5,0.01);
T3Periods = Param("T3 Periods",3,1,10,1);
Reset = GapUp() OR GapDown();
ResetReference = (H+L+C)/3;
T3rPlot = T3r( C, T3Sensitivity, T3Periods, ResetReference );
Plot(C,"\nClose",IIf(Reset,2,1),128);
Plot(T3rPlot,"\nResetable T3",4,1|styleThick);
Plot(T3( C, T3Periods, T3Sensitivity),"\nTraditional T3",6,1|styleThick);

Edited by Al Venosa

« Previous PageNext Page »