The Edge of Auto-Trading

Ten reasons you might want to Automate your Trades

  1. More fun. It is mesmerizing and great fun to see your orders being placed, modified, and filled faster than any human trader could ever do – and to do so error-free.
  2. Less stress. Trading under the pressure of a fast moving market may be very stressful. Having your system do all the work for you without order entry error drastically reduces stress.
  3. Simple User-Interface. For most of us, Interactive Brokers’ Trader Work Station (TWS) is bloated with goodies we never use and, sometimes, is awkward to use. AmiBroker allows you to design your personalized Trading Interface with only the functions you need. This means you can minimize the TWS, save screen space, and trade from your very own personalized Trading Interface.
  4. Greater efficiency. Whether you trade Intraday or end-of-day (EOD), manually calculating prices for many complex orders can be time-consuming. Using automation you can do all those calculations in real time and without any delays.
  5. Increased flexibility. You can make up your own order types, switch trading rules, set stop strategies, etc., and change them on the fly.
  6. Less emotional. We all know that emotional trading can kill even the best mechanical system. Your automated mechanical system will follow your trading rules flawlessly and automatically, never second-guessing mechanical signals.
  7. Increased responsiveness. Using automation, prices can be recalculated and orders modified, perhaps even executed, faster than the most efficient and fastest touch typist can enter them.
  8. Greater accuracy. No possibility of entry errors when ordering, ever!
  9. Trading Niche. While the popularity of automated trading is rising rapidly, there may still be a unique niche for the small trader using automation. The price excursions and volumes may be too small for fund traders but may be perfect for the small trader.
  10. Increased profitability. If you are trading a profitable mechanical system, adding automation to it will almost certainly increase your profits.

Edited by Al Venosa

DebugView: _TRACE() Statements and Logging

_Trace() Statements

If you use many debug statements, you can speed up your code by using conditional debug code (shown below), and you can control debug output with a ParamToggle() using _TRACE statements:

DBVOn = ParamToggle("DebugView","OFF|ON", 0);
if( DBVOn ) _TRACE( "# "+ YourDebuggingText );

To keep your main code short and simple, you can also wrap the _TRACE() statement into a similarly named custom TRACE() function that you would call instead of the _TRACE() (note the “_” has been removed):

function TRACE( DBVString )
{
global DBVOn;
if( DBVOn ) _TRACE( "# "+ YourDebuggingText );
}

You may find it handy to keep the debugging code in the system until it is fully functional or, if the minor speed penalty is no problem, turn it off and leave it there permanently. You can also create a custom library of debugging functions and make them available for use at any time by including them in your code using a #Include statement, which are stored in the folder C:\Program Files\AmiBroker\Formulas\Include. This path is defined in Tools/Preferences/AFL/Standard Include Path/Formulas/Include.

Logging

Using too many _TRACE() statements or allowing the DebugView output file grow too large will slow down AFL execution. To prevent the file from growing too large, it is a good idea to add a manual clear function so that you can clear it occasionally:

ClearDBV = ParamTrigger("Clear DebugView","CLEAR DBV");
if( ClearDBV ) _TRACE("# DBGVIEWCLEAR");

You can further reduce overhead by controlling the amount of logging detail. You do this by using a ParamList() whereby you can set the required logging level. For example, you might want to control debug statements inside and outside a loop separately. Below is a simple example that scans a Watchlist from your Indicator once every 5-seconds:

RequestTimedRefresh(5);
ClearDBV = ParamTrigger("Clear DebugView","CLEAR DBV");
if( ClearDBV ) _TRACE("# DBGVIEWCLEAR");
DBVLevel = ParamList("DBV Logging Level","NO LOGGING|SCAN TIME ONLY|SCAN TIME AND LOOP",0 );
DBVL1 = DBVLevel == "SCAN TIME ONLY";
DBVL2 = DBVLevel == "SCAN TIME AND LOOP";
scan = Status("redrawaction");
if( Scan )
{
if( DBVL1 OR DBVL2) _TRACE( "#1 Scan Triggered at "+Now(0) );
TickerList = ParamStr("Ticker List","AAPL,BRCM,CSCO,MXIM,GOOG");
for( i = 0; ( Ticker = StrExtract( TickerList, i ) ) != ""; i++ )
{
TickerPrice = GetRTDataForeign("Last",Ticker);
if( DBVL2 )
{
_TRACE( "#2 Scanning "+Ticker+", "+NumToStr(TickerPrice,1.2));
}
}
if( DBVL2 ) _TRACE("#"); // Skip a line in the log
}

Edited by Al Venosa

Wrapping Functions

During development of Automated Trading systems, “wrapping” functions (i.e., calling a standard function from a custom function) for the Interactive Brokers Controller (IBc) allows you to add debug statements to your code without making your main code difficult to read. Here is an example where the standard ibc.IsOrderPending() is wrapped by a custom afl function named IsOrderPending():

function IsOrderPending( ORderID )
{
global ibc;
IsPending = ibc.IsOrderPending( ORderID );
TRACE("# Pending Status for OrderID: " + ORderID + " is "+NumToStr(IsPending,1.0));
return IsPending;
}

Instead of calling the IBc function directly, you now call it from a function that is identically named but has the prefix ibc. removed. This allows you to attach debugging statements and utility code (such as managing OrderIDs) to your automated trading (AT) functions without increasing the length of your main code. All you have to do to restore full speed operation is to re-attach the ibc. to the wrapper function names. Other ibc. functions can be wrapped similarly.

Wrapping functions slow down AFL slightly, but the loss in speed is more than offset and justifiable by the lack of clutter in your main code with long _TRACE() statements.

Edited by Al Venosa

DebugView: Introduction and Setup

DebugView is an essential development, debugging, and trading tool.

When developing Automated Trading Systems, you need to know when orders have gone out, what their parameters were, whether they were accepted and processed, what error messages were received, etc. When you place an automated order, you cannot simply assume that your order was executed and filled. You must always verify order and system status and be able to act on irregularities.

Debugging techniques reflect personal working habits, and the examples you’ll find in the Debug Category of the Users’ Knowledge Base are intended to help you develop your own debugging strategies, not to provide the perfect debugging setup for you.

Using _TRACE() statements will slow down the speed of code executions somewhat, and you should exercise care when using them. For example, you should never permanently embed _TRACE() statements inside a loop with a thousand iterations. This would result in thousands of lines being output to DebugView and noticeably slow down your AFL execution. Another option is to selectively enable and disable _TRACE() output by using the Param() user input; this topic is covered under the heading of DebugView: _TRACE() Statements and Logging.

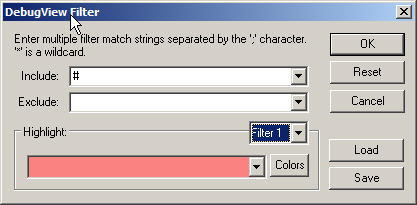
You can use DebugView to create a detailed logging file that will show you exactly what happened, when it happened, and in what sequence. To reject output from other programs on your computer, all _TRACE() output strings start with a “#” character. This is done so that you can set up your DebugView -> Edit -> Filter/HighLight to pass only your statements that begin with “#”:

snag-0856.jpg

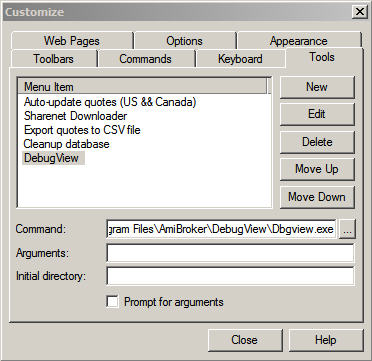
To install DebugView, download, unzip, and copy the dbgview.exe program to the C:\Program Files\AmiBroker\DebugView folder. Then, in AmiBroker, go to Tools -> Customize -> Tools -> New and change MenuItem to DebugView. Next, click on the three dots inside the Command box and browse for the DebugView program, which is located at C:\Program Files\AmiBroker\DebugView\Dbgview.exe, and click on it. Finally, click the Close button, and you are finished. From now on, you can start up DebugView from AmiBroker by simply clicking Tools -> DebugView.

snag-0775.jpg

It cannot be stressed enough that DebugView is an indispensable tool in the development of Real-Time Automated trading systems.

DebugView is free, and you can download it from http://www.microsoft.com/technet/sysinternals/utilities/debugview.mspx

Edited by Al Venosa

« Previous Page