August 16, 2007
IO – Ease of Use
This page is obsolete. Current versions of AmiBroker feature built-in non-exhaustive, smart multithreaded optimizer and walk-forward engine.
As stated previously IO Directives will by definition be seen as comments by AB / AA / AFL and are thus unintrusive. Below is a simple AFL with the required IO Directives in it.
ShrtLen    = Optimize("ShrtLen",         2,     0,   500,     1);
LongLen    = Optimize("LongLen",       304,     0,   500,     1);
UpPct      = Optimize("UpPct",        0.01,     0,    10,  0.01);
DnPct      = Optimize("DnPct",        0.36,     0,    10,  0.01);

ShrtAMA = AMA(C, 2 / (ShrtLen + 1));
LongAMA = AMA(C, 2 / (LongLen + 1));

if (ShrtLen < LongLen)
{
    Buy     = Cross(ShrtAMA, LongAMA * ( 1 + UpPct / 100 ));
    Sell    = Cross(LongAMA * ( 1 - DnPct / 100 ), ShrtAMA);

    Short   = Sell;
    Cover   = Buy;
}
That’s right … There aren’t any required directives.
IO was meant to be a tool for USERS.
All the IO Directives are optional as they all have default values, all of which with a few notable exceptions I have set to what I believe the best settings to be are. As a result there is no learning curve to climb in order to run IO.
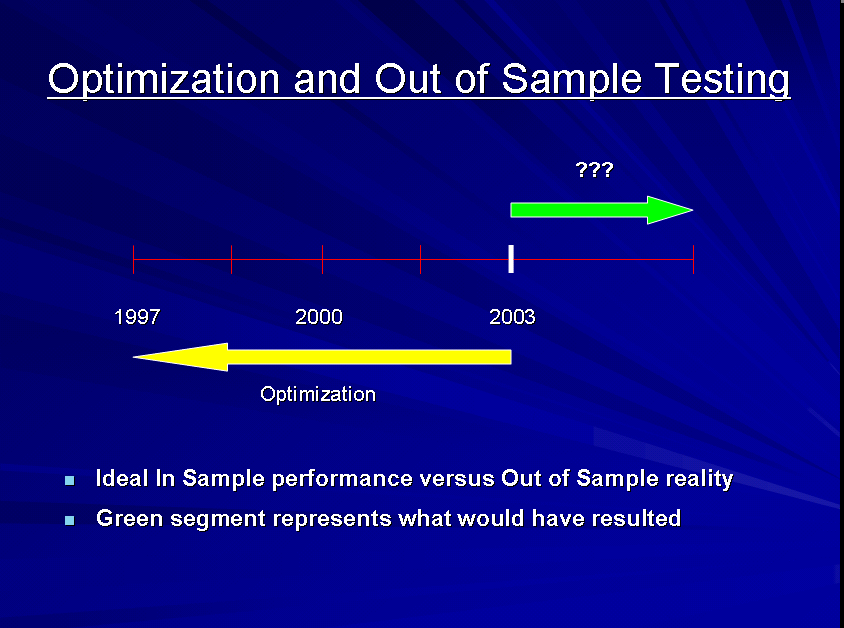
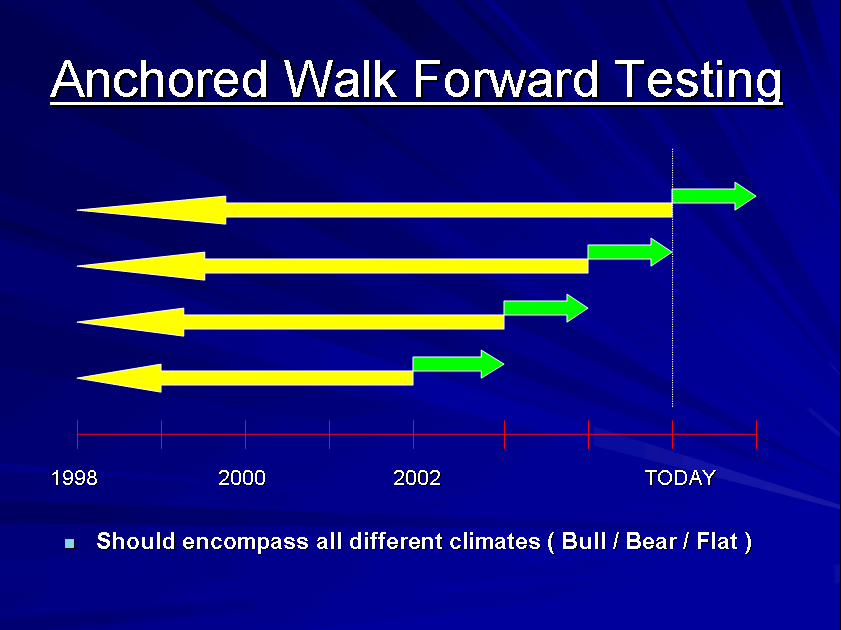
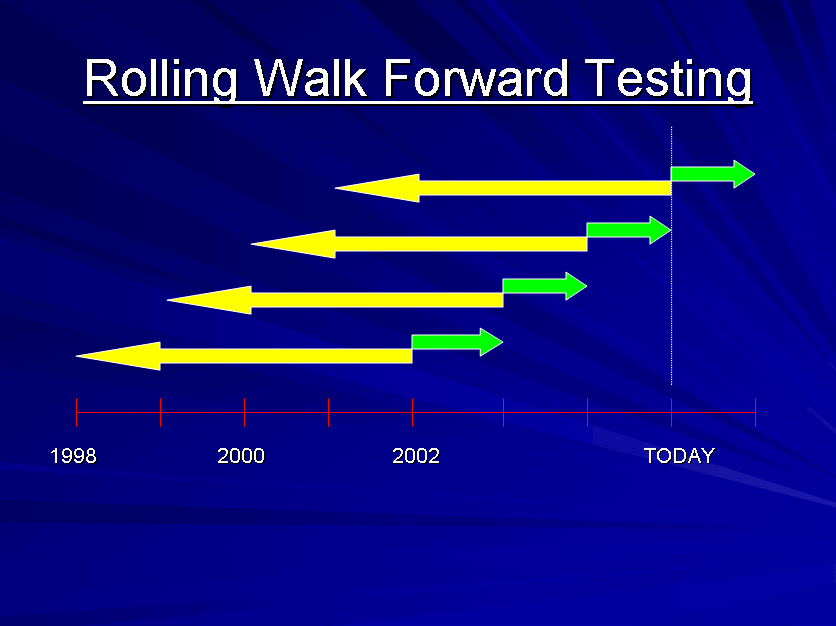
Getting the most out of IO by utilizing sensitivity testing during in sample optimization and performing walk forward testing does require knowledge of how to write those directives which anyone should be able to get up to speed on in a few minutes.
Initial setup of IO involves copying the IO Tasks.hta, IO.exe and IO.ico files from a zip to your AmiBroker directory. Following that one would want to set up easy access to the IO Task Bar as it is the control center for all IO operations. This can be from the AmiBroker, Tools, Custom menu or from the Windows Desktop or Quick Launch Bar ( My preference because its a single click ). Once that’s established, clicking on the icon for the IO Task Bar will bring it up in the top left corner of the screen typically overlaying the AmiBroker title bar. It can of course be moved to wherever the user desires.

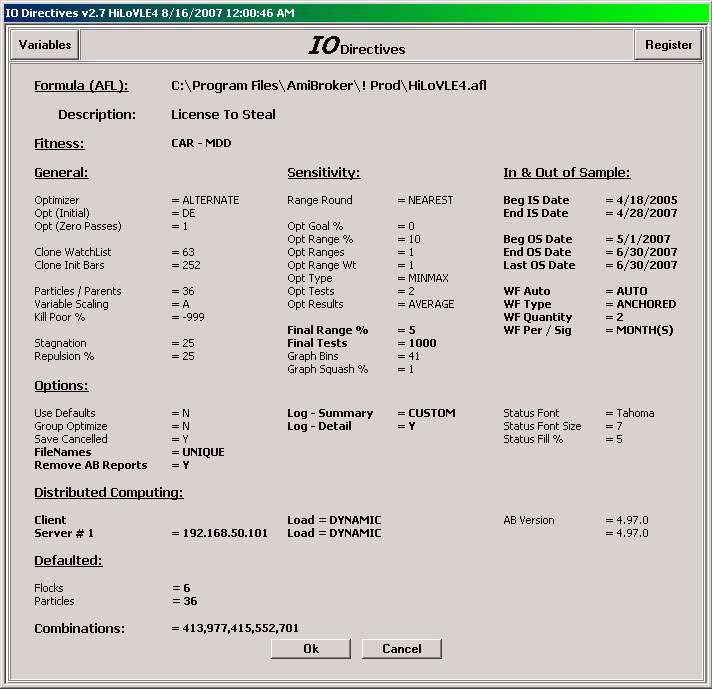
Clicking RUN on the IO Task Bar will start an IO run much like clicking Optimize in AB/AA or FE would start a regular AmiBroker optimization. When IO begins it will first show the user the values for all the IO Directives, with the ones not having default values being in bold. This provides the user a chance to review the directives and cancel the run prior to its beginning if modification to some directive is desired.
Once the user clicks OK on the Directives screen, optimization begins. What one would see during optimization is short bursts of the AB Optimization progress bar which will appear, run to completion, disappear and then repeat. IO is only active for very short spans of time, typically a fraction of a second, between the time that the AB Optimization progress bar disappears and when it reappears.
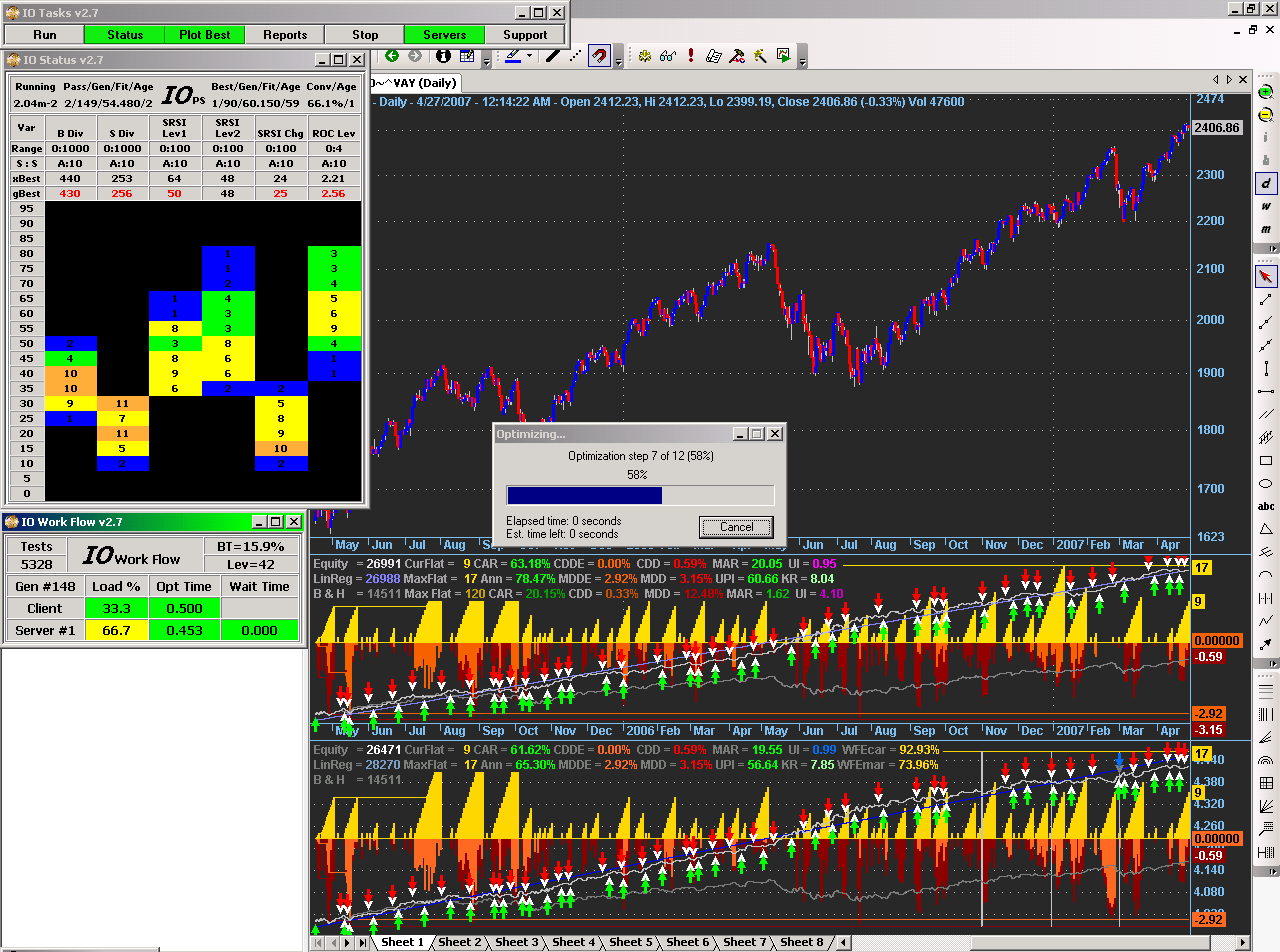
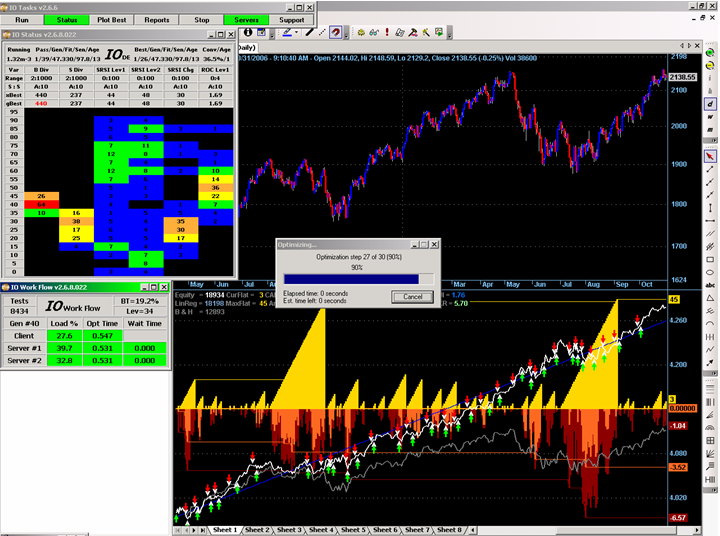
Other options from the IO Task Bar while IO is running are …
– Status – Shows the status of the run ( Shown Above )
– Plot Best – Will automatically update an Equity Curve ( AB’s, Yours or Mine ) as new best solutions are found
– Stop – Will allow the run to be paused or cancelled
– Servers – Shows the Work Flow between client and server(s) ( Shown Above )
IO Task Bar On/Off Type Buttons will change color when activated as shown above. When a run is completed the equivalent of clicking the Reports button will occur which is to provide GUI access to all the Reports and Screens relative to the current and previous runs.
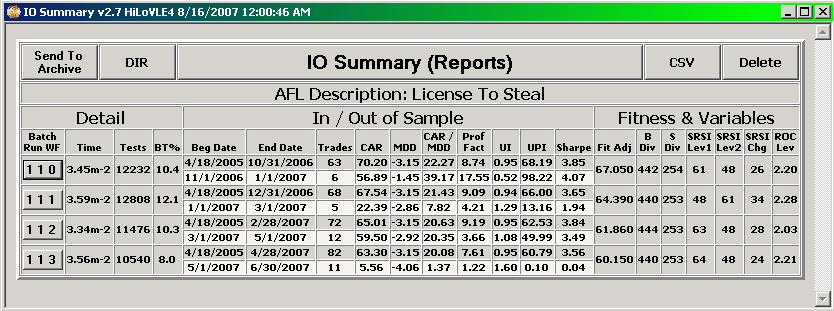
This is the initial screen that will display:

When an individual button relating to an IO run for an AFL for a specific run date and time is clicked then the summary for that run will appear.
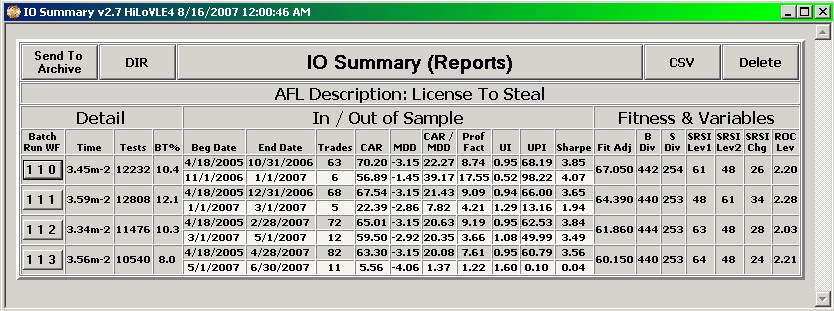
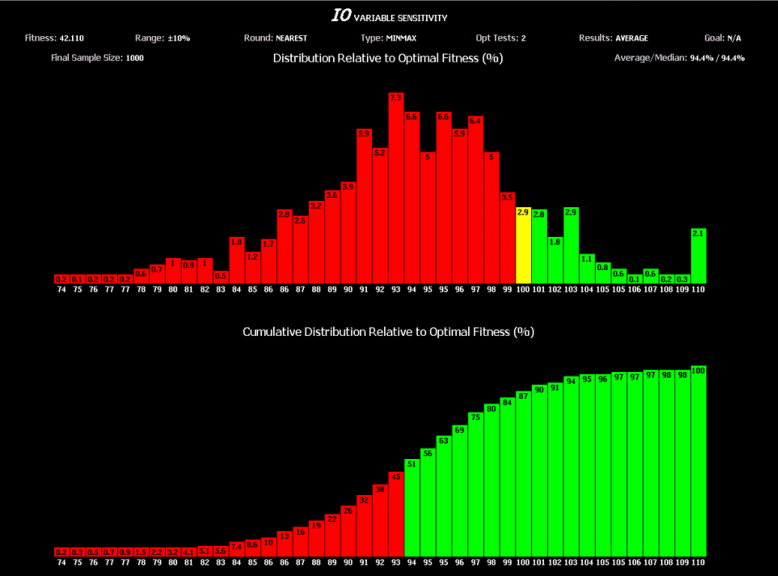
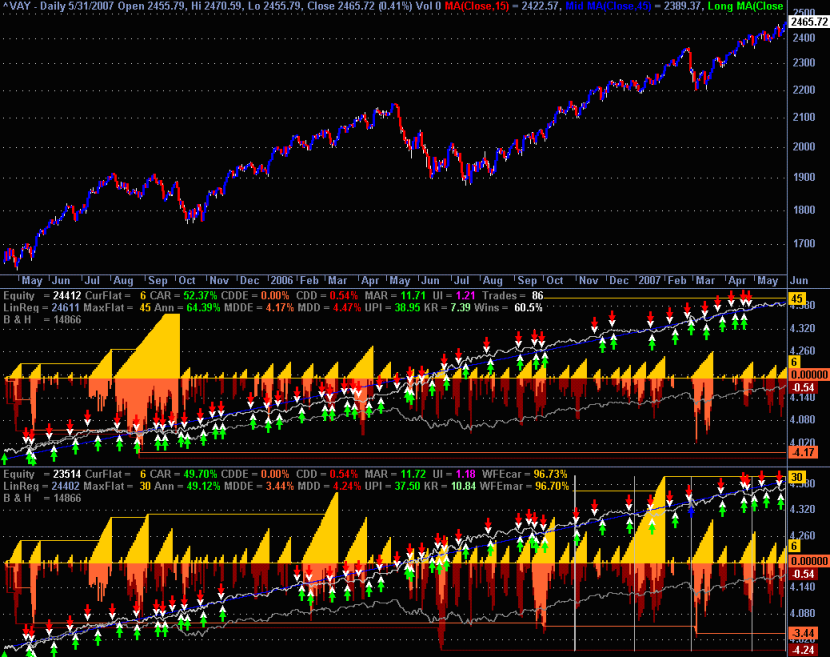
This typically shows the amount of time the run took and the number of tests performed along with whatever performance metrics the user desires as well as the parameter values of the best solution from optimization. If Out Of Sample testing was performed then there will an additional line of performance metrics for the out of sample period. If Walk Forward testing was performed then there will be multiple groups of the above information i.e. one for each Walk Forward segment. Clicking on a button for a particular segment brings up a detail screen which shows the chart as of the end of that particular segment, the trade list for the in and out of sample period it covers and the result of final sensitivity testing.
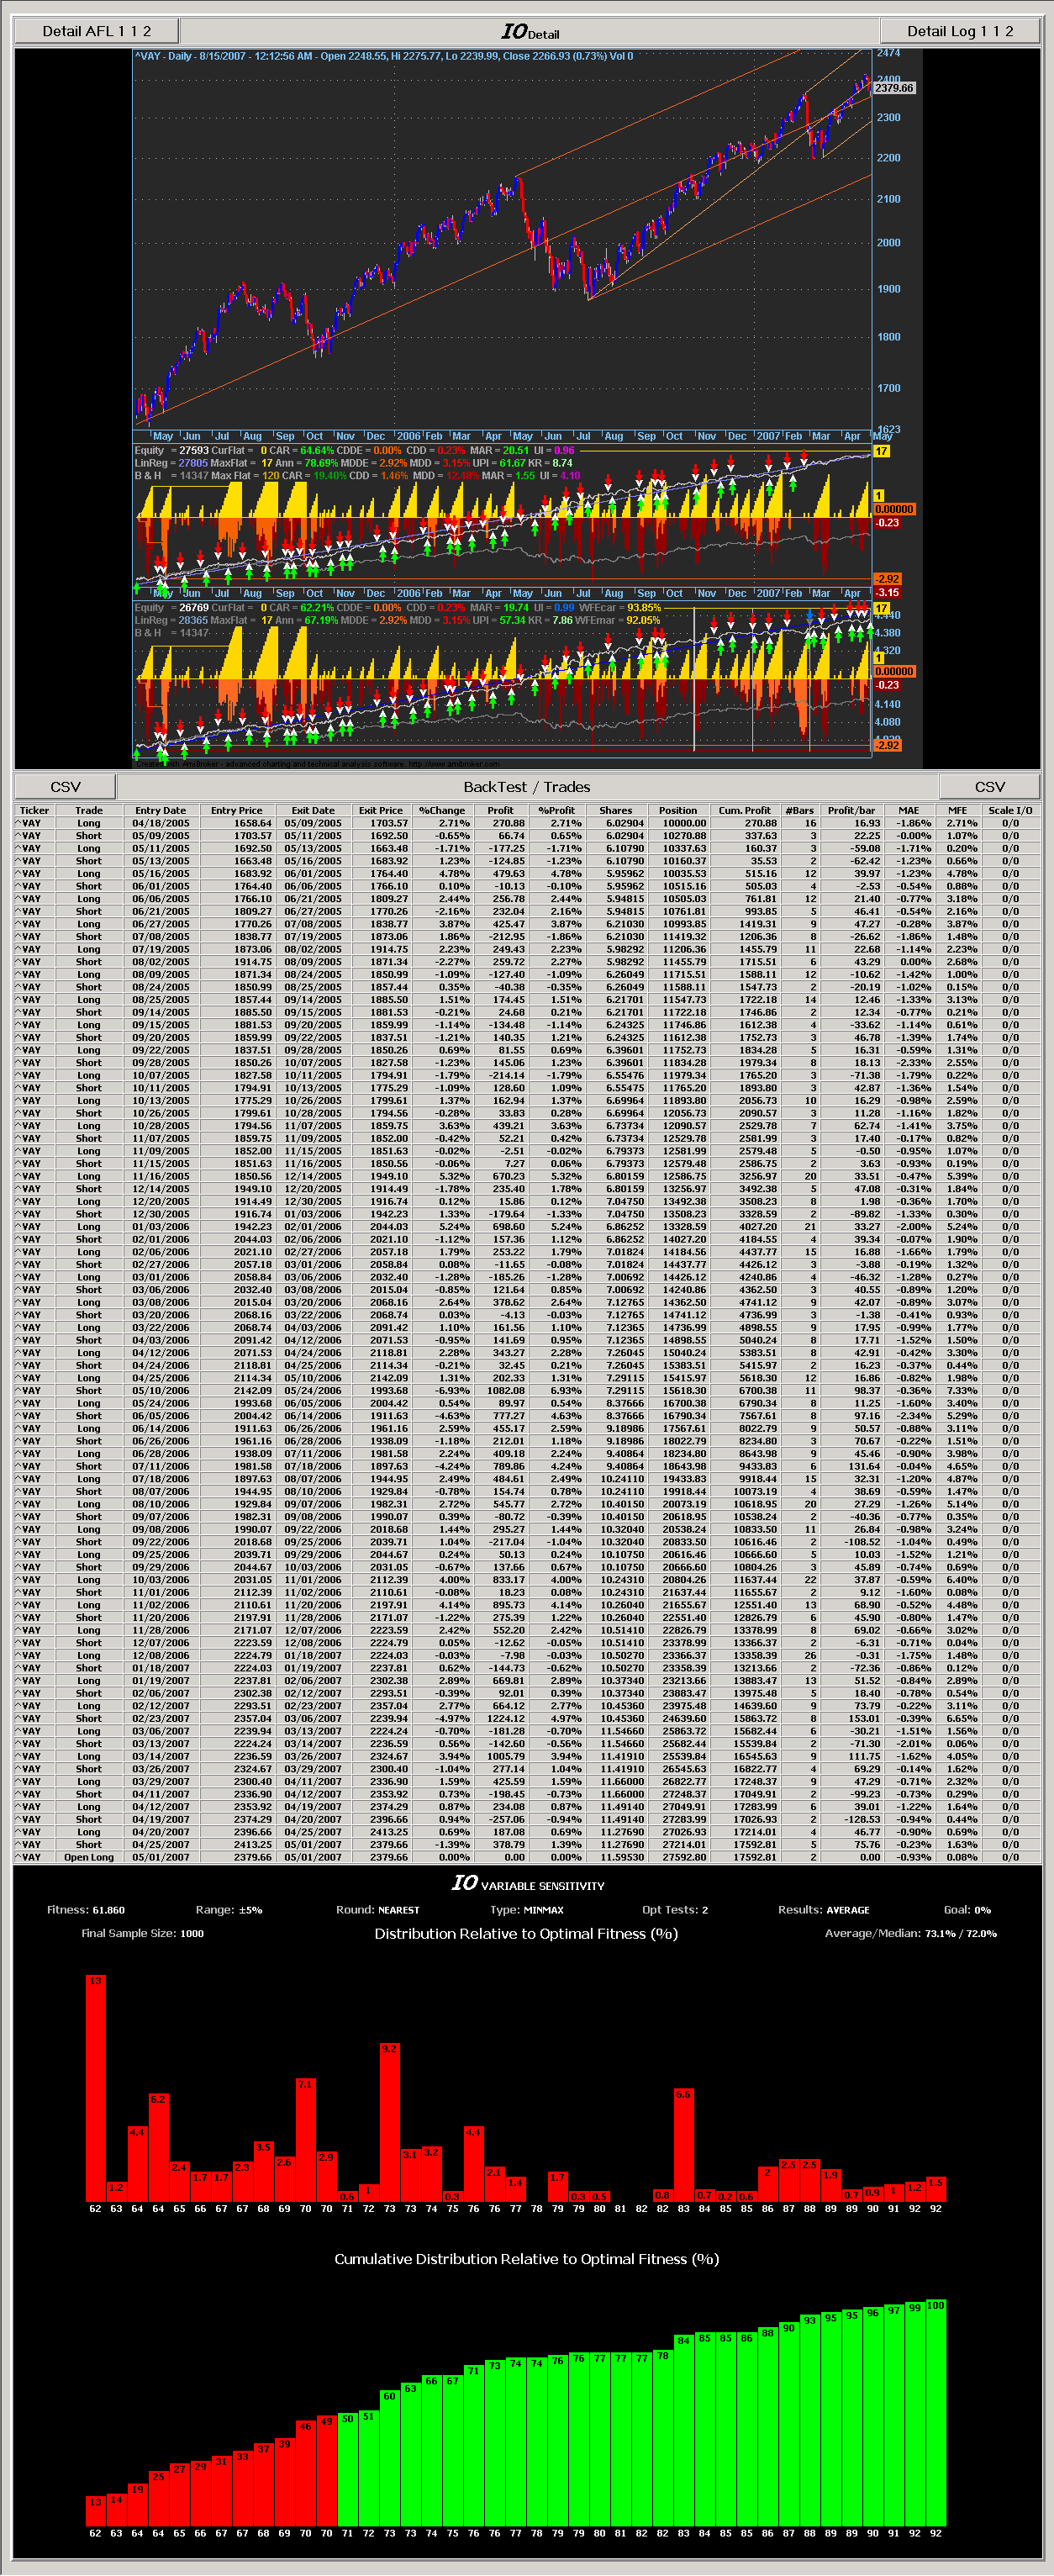
The Detail Screen has buttons to:
– Open a CSV file of the Trades, assumedly in Excel, for further manipulation if desired
– Show the AFL in play with the parameter values from optimization put into the default values of the optimization statements
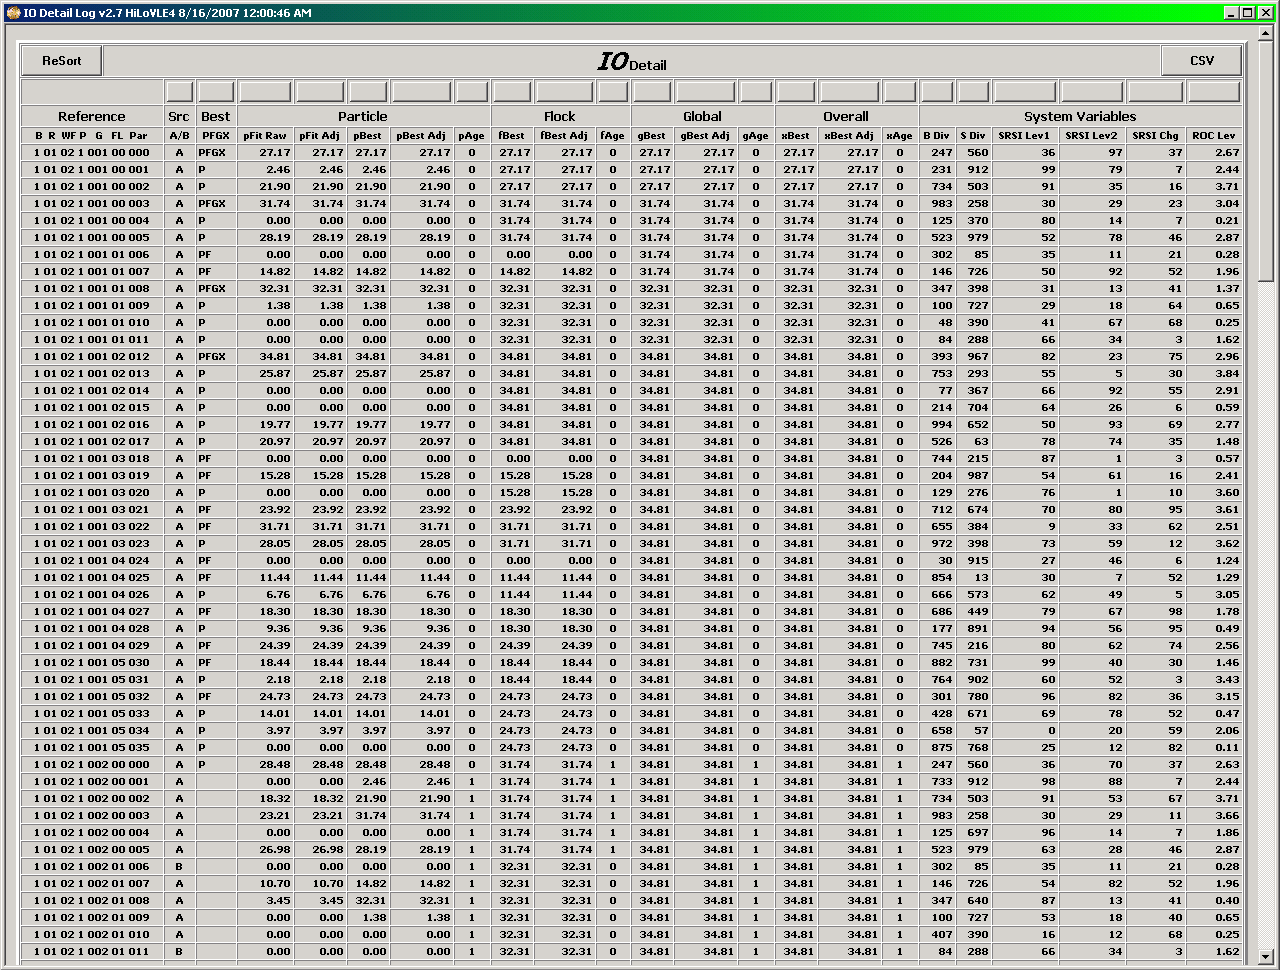
– Show the Detail Log if requested by IO Directive which will show the results of every test performed during optimization and can be sorted in any order desired.
A shareware version of IO with full documentation can be found in the AmiBroker Files Section …
http://groups.yahoo.com/group/amibroker/files/IO.zip
http://www.amibroker.org/userkb/wp-content/uploads/2007/08/io-reports.png
 Filed by Fred at 11:11 pm under Intelligent Optimization
Comments Off on IO – Ease of Use

