
December 31, 2014
Drawing indicators on a subset of visible bars
By default, the Plot function draws the graph for all visible bars. In some situations however, we may want to draw some selected bars, leaving remaining chart space unaffected.
To achieve that – we simply assign Null value for the bars that we want to skip. Our graph will just be drawn for the non-null bars.
This simple example draws candlesticks only on Mondays and leaves empty all the other days.
IsMonday = DayOfWeek() == 1;
// assign Close for Mondays, otherwise assign Null
Data = IIf( IsMonday, Close, Null );
// plot the data
Plot( Data, "Chart of Mondays", colorDefault, styleCandle )
The following example shows how to restrict the visibility to last N bars. The code defines a custom function, which can be called later on for the arrays we want to show only partially.
// custom function definition
function LastNBars( array, bars )
{
    bi = BarIndex();
    lvbi = LastValue( bi );

    // use Null value for bars other than last N
    return IIf( bi > lvbi - bars, array, Null );
}

// price plot
Plot( Close, "Close", colorDefault, styleBar );

// MA-50 restricted to last 10-bars only
line = MA( Close, 50 );
Plot( LastNBars( line, 10 ), "last 10 bars", colorRed );

// shaded area
Plot( LastNbars( True, 10 ), "", colorYellow, styleArea|styleOwnScale|styleNoLabel, 0, 1, 0, -1 )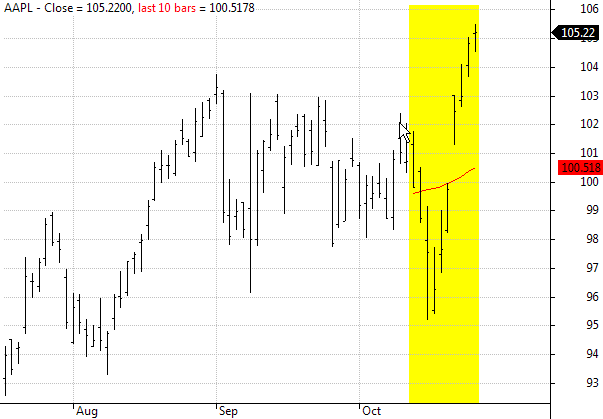
In the above chart both Moving average (red line) and yellow shading area have been restricted to last 10-bars only.
In a similar way we can restrict the visibility to most recent day only in intraday chart:
// custom function definition
function ShowLastDay( array )
{
    dn = datenum();
    lastDay = dn == LastValue( dn );

    return IIf( lastDay, array, Null );
}

// price plot
Plot( Close, "Close", colorDefault, styleBar );

// daily high / low on last day only
dailyH = TimeFrameGetPrice("H", inDaily );
dailyL = TimeFrameGetPrice("L", inDaily );
Plot( ShowLastDay( dailyH ), "dailyH", colorGreen, styleThick  );
Plot( ShowLastDay( dailyL ), "dailyL", colorRed, styleThick  );

// shaded area
colorPaleYellow = ColorBlend(colorWhite, colorYellow, 0.1);
style = styleArea | styleOwnScale | styleNoLabel;
Plot( ShowLastDay( 1 ), "", colorPaleYellow, style, 0, 1, 0, -1 )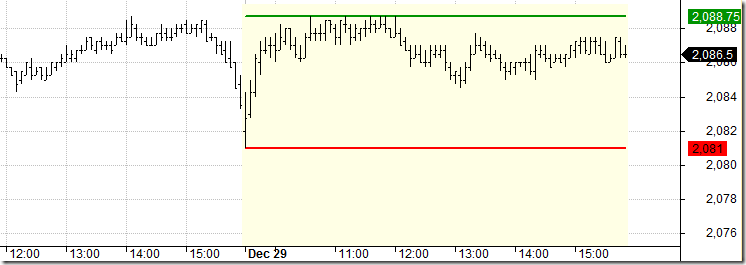
Other practical implementations of such technique is presented in these formulas:
http://www.amibroker.com/kb/2007/03/24/how-to-plot-a-trailing-stop-in-the-price-chart/
http://www.amibroker.com/kb/2014/10/10/how-to-draw-regression-channel-programatically/
 Filed by Tomasz Janeczko at 5:45 am under Indicators
Comments Off on Drawing indicators on a subset of visible bars