amibroker

Home ▸ Knowledge Base

Troubleshooting procedure when backtest shows no trades

When we run backtest and get no results at all – there may be several reasons of such behaviour. The main potential causes are the following:

  1. our system does not generate any entry signals within the tested range
  2. our settings do not allow the backtester to take any trades

To verify if we are getting any signals – the first thing to do is to run a Scan. This allows us to check if we are getting any Buy or Short signals at all. If there are none, then we need to check the formula and make sure that data interval we are working on are correct (in Periodicity in Analysis->Settings->General).

If Scan works fine and returns trading signals, but backtester still does not produce any output, it usually means that the settings are wrong, i.e. the constraints set in the settings prevent trades from being opened mainly because requested position size is too big or too small.

To check what is going on, it is best to switch Report mode to Detailed log and re-run backtest.
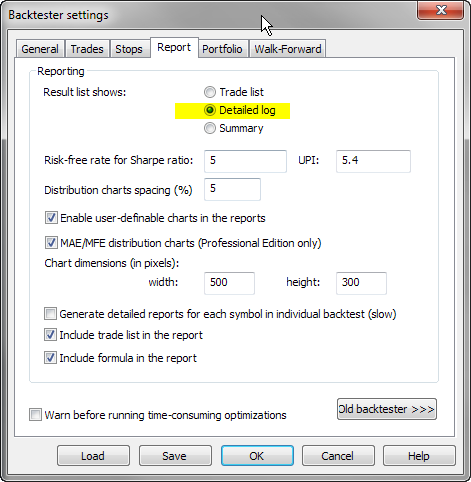
Report - Detailed log

Once you run backtest in Detailed Log mode you will be able to find out exact reasons why trades can not be opened for each and every bar:
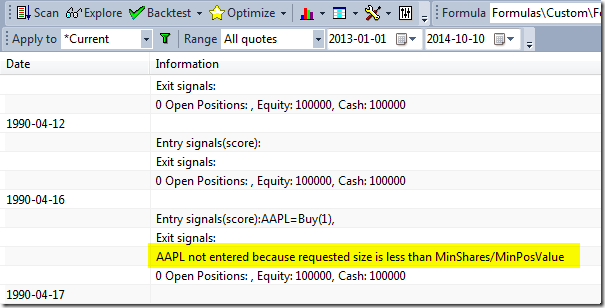
Detailed log output

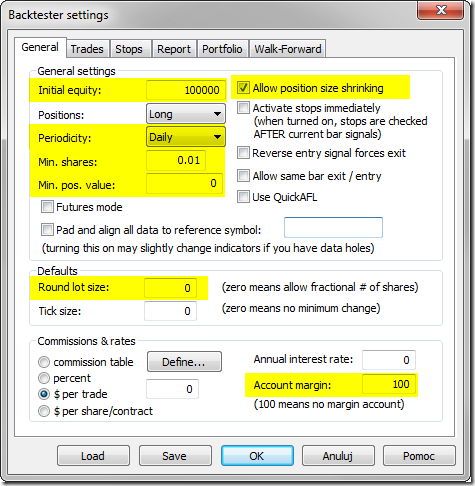
Using the following settings may be helpful to minimize chances of not entering trades because of various constraints:

In Analysis->Settings, General tab:

  1. check if Initial Equity is high enough
  2. set Periodicity to the appropriate interval
  3. Allow position size shrinking – turn it On
  4. Round Lot Size – set it to 0
  5. in Min. Shares box enter 0.01
  6. in Min. pos. value enter 0
  7. Account Margin – set it to 100

Settings - General

in Portfolio tab, enter 0 in Limit trade size as % of entry bar volume box.
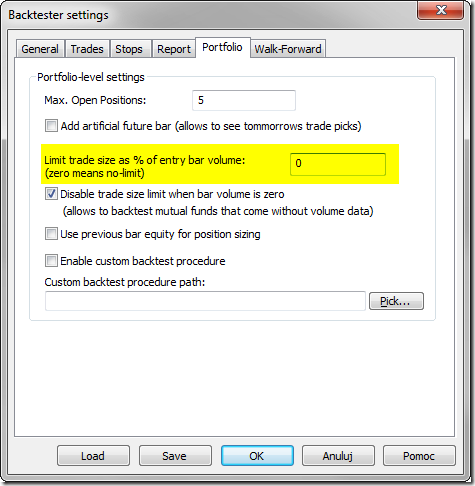
Settings - Portfolio

Too small / unreadable Profit Table in the backtest report

Some of users may observe that their Profit table is too small, so the numbers get truncated or the text is too small.

First let me tell you that profit table in the backtest report is not really a table, but a bitmap image with fixed dimensions. Profit table, like any other user-definable report chart, is created by running an AFL formula present in the “Report charts” subfolder. The chart is rendered into bitmap image that gets later embedded in the backtest report.

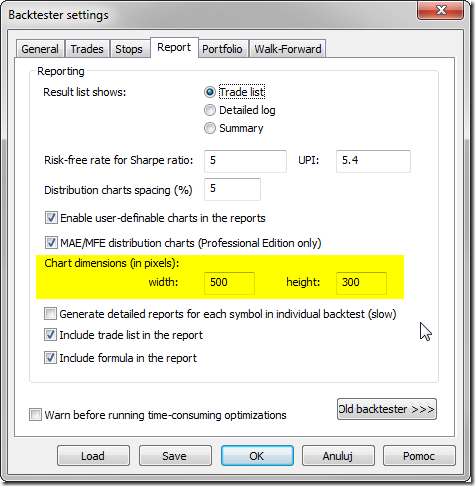
The size of backtest report images depends on Analysis window settings. In order to increase the size of generated images, it is necessary to go to Analysis -> Settings, Report tab and increase the picture dimensions:

reportchartdim

Once you change it, newly generated reports will use enlarged image dimensions. Adjusted settings will affect new backtests only, but not the old reports that have already been generated.

Tip: You can create your own report charts by placing your own AFL formula in the “Report charts” subfolder.

Low-level gfx example: Yearly/monthly profit chart

The code below is an little bit more complex example of Low Level Graphics functions (see http://www.amibroker.com/guide/a_lowlevelgfx.html)

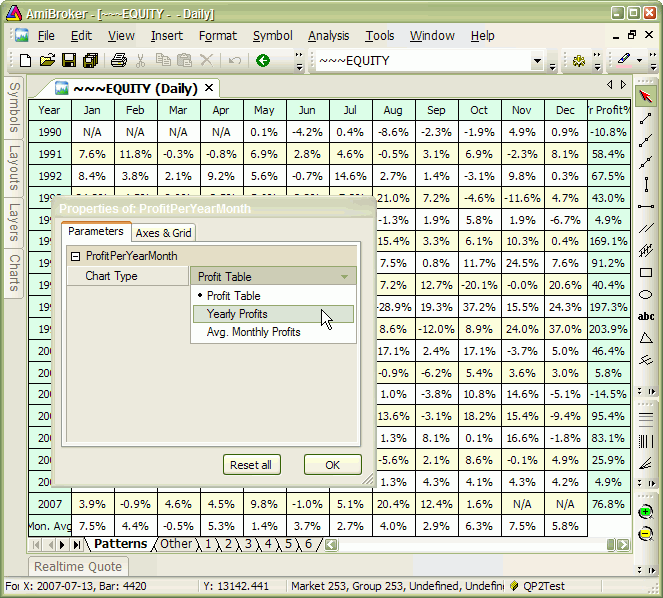
It allows to display three kinds of charts:

  1. yearly/monthly profit table
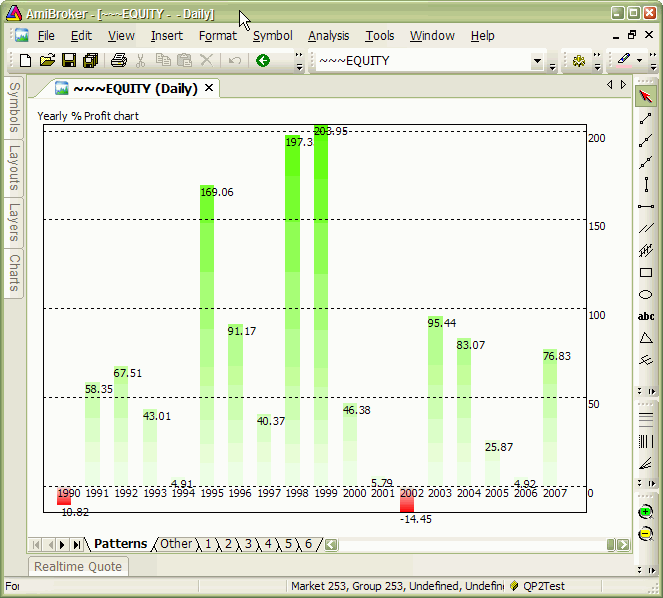
  2. yearly profit bar chart
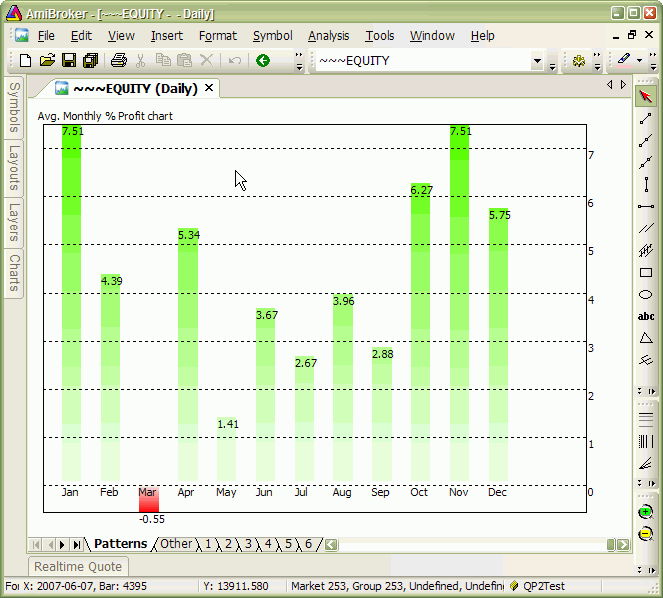
  3. average monthly profit bar chart

The type of chart is switchable from Parameters dialog.

It should be applied to ~~~EQUITY – portfolio equity symbol (so it only produces output if you run backtest before using it).


SetBarsRequired(1000000,1000000);
eq = Foreign("~~~EQUITY", "C" );

yr = Year();
mo = Month();

YearChange = yr != Ref( yr, -1 );
MonChange = mo != Ref( mo, -1 );

FirstYr = 0;
LastYr = 0;

startbar = 0;

////////////////////////////
// SKIP non-trading bars
////////////////////////////
for( i = 0; i < BarCount; i++ )
{
  if( 
eq[ i ] )
  {
    
startbar = i;
    break;
  } 
}

////////////////////////////
// collect yearly / monthly changes in equity
// into dynamic variables
////////////////////////////

LastYrValue = eq[ startbar  ];
LastMoValue = eq[ startbar  ];

MaxYrProfit = MinYrProfit = 0;
MaxMoProfit = MinMoProfit = 0;

for( 
i = startbar + 1; i < BarCount; i++ )
{
  if( 
YearChange[ i ] || i == BarCount - 1 )
  {
    
Chg = 100 * ( -1 + eq[ i ] / LastYrValue );
    
VarSet("ChgYear"+ yr[ i - 1 ], Chg );

    
MaxYrProfit = Max( MaxYrProfit, Chg );
    
MinYrProfit = Min( MinYrProfit, Chg );

    if( 
FirstYr == 0 ) FirstYr = yr[ i - 1 ];
    
LastYr = yr[ i ];

    
LastYrValue = eq[ i ];
  }

  if( 
MonChange [ i ] || i == BarCount - 1 )
  {
    
mon = mo[ i - 1 ];

    
Chg = 100 * ( -1 + eq[ i ] / LastMoValue );

    
VarSet("ChgMon" + yr[ i - 1 ] + "-" + mon, Chg );
    
VarSet("SumChgMon"+ mon, Chg + Nz( VarGet("SumChgMon"+ mon ) ) );
    
VarSet("SumMon" + mon, 1 + Nz( VarGet("SumMon"+ mon ) ) );
 
    
MaxMoProfit = Max( MaxMoProfit, Chg );
    
MinMoProfit = Min( MinMoProfit, Chg );

    
LastMoValue = eq[ i ];
  }
}

/////////////////////////////////////////////////
// Drawing code & helper functions
////////////////////////////////////////////////

GfxSetOverlayMode( 2 );

CellHeight = (Status("pxheight")-1)/(LastYr - FirstYr + 3 ); 
CellWidth = (Status("pxwidth")-1)/14; 
GfxSelectFont( "Tahoma", 8.5 ); 

GfxSetBkMode( 1 );

function 
PrintInCell( string, row, Col ) 
{
 
Color =  ColorRGB( IIf( row == 0 || col == 0 || col == 13, 220, 255 ), 255, IIf( row % 2, 255, 220 ) );
 
GfxSelectSolidBrush( Color   );
 
GfxRectangle( Col * CellWidth, 
                    
row * CellHeight, (Col + 1 ) * CellWidth + 1, 
                    (
row + 1 ) * CellHeight  + 1); 
 
GfxDrawText( string, Col * CellWidth + 1, 
                    
row * CellHeight + 1, 
                    (
Col + 1 ) * CellWidth, (row + 1 ) * CellHeight, 32+5 ); 
} 


YOffset = 25;
XOffset = 15;

function 
DrawBar( text, bar, numbars, y, Miny, Maxy )
{
 
BarWidth = (Status("pxwidth") - 4 * XOffset )/( numbars + 1 ); 
 
BarHeight = Status("pxheight") - 2 * YOffset;
 
relpos = ( y - Miny ) / (Maxy - Miny );

 
xp = XOffset + ( bar + 0.5 ) * BarWidth;
 
yp = YOffset + BarHeight * ( 1 - relpos );
 
xe = XOffset + ( bar + 1 ) * BarWidth;
 
ye = YOffset + BarHeight * ( 1 - ( -miny )/( maxy - miny ) );
  
 if( 
y > 0 )
 {
 
GfxGradientRect( xp, yp,
                  
xe , ye,
                  
ColorHSB( 70, 255 * relpos, 255 ), ColorHSB( 70, 20, 255 ) );
 }
 else
 {
 
GfxGradientRect( xp, ye,
                  
xe , yp,
                  
ColorHSB( 0, 20, 255 ), ColorHSB( 0, 255 * ( 1 - relpos ), 255 ) );
 }
 
GfxTextOut( text, xp, ye );
 
GfxTextOut( StrFormat("%.2f", y ), xp, yp );
}    

function 
DrawLevels( Miny, Maxy )
{
  
range = Maxy - Miny;

  
grid = 100;
  if( 
range < 10 ) grid = 1;
  else 
  if( 
range < 20 ) grid = 2;
  else 
  if( 
range < 50 ) grid = 5;
  else 
  if( 
range < 100 ) grid = 10;
  else 
  if( 
range < 200 ) grid = 20;
  else 
  if( 
range < 500 ) grid = 50;

  
_TRACE("grid = "+grid +" range "+range );
  
  
width = Status("pxwidth") - 4 * XOffset;
  
height = Status("pxheight") - 2 * YOffset;

  
GfxSelectPen( colorBlack, 1, 2 );
  for( 
y = grid * ceil( Miny / grid ); y <= grid * floor( Maxy / grid ); y += grid )
  {
    
yp =  YOffset + Height * ( 1 -  ( y - Miny ) / (Maxy - Miny ) );

    
GfxMoveTo( XOffset, yp );
    
GfxLineTo( XOffset + width , yp );
    
GfxTextOut( ""+ y, XOffset + 2 + width, yp );
  }

  
GfxSelectPen( colorBlack, 1, 0 );
  
GfxMoveTo( XOffset, YOffset );
  
GfxLineTo( XOffset + width, YOffset );
  
GfxLineTo( XOffset + width, YOffset + Height );
  
GfxLineTo( XOffset , YOffset + Height );
  
GfxLineTo( XOffset , YOffset );
}

MonthNames = "Jan,Feb,Mar,Apr,May,Jun,Jul,Aug,Sep,Oct,Nov,Dec";

function 
DisplayProfitTable( )
{
 
Header = "Year,"+MonthNames+",Yr Profit%";
 for( 
Col = 0; (Colname = StrExtract( Header, Col ) ) != ""; Col++ )
 {
  
PrintInCell( ColName, 0, Col );
 }

 
Row = 1;
 for( 
y = FirstYr; y <= LastYr; y++ )
 {
  
PrintInCell( StrFormat("%g", y ), Row, 0 ); 
  
PrintInCell( StrFormat("%.1f%%", VarGet("ChgYear" + y ) ), Row, 13 ); 
  for( 
m = 1; m <= 12; m++ )
  { 
   
Chg = VarGet("ChgMon" + y + "-" + m);
   if( 
Chg ) 
     
PrintInCell( StrFormat("%.1f%%", Chg ), Row, m );
   else
     
PrintInCell( "N/A", Row, m );
  }
  
Row++;
 } 

 
PrintInCell("Mon. Avg", Row, 0 );
 for( 
m = 1; m <= 12; m++ )
 { 
   
PrintInCell( StrFormat("%.1f%%",  Nz( VarGet("SumChgMon" + m)/VarGet("SumMon" + m ) ) ), Row, m );
 }

}

function 
DisplayYearlyProfits()
{
 
Bar = 0;
 for( 
y = FirstYr; y <= LastYr; y++ )
 {
   
Chg = VarGet("ChgYear" + y );
   
DrawBar( ""+y, Bar++, ( LastYr - FirstYr + 1 ), Chg, MinYrProfit, MaxYrProfit );
 }
 
GfxTextOut("Yearly % Profit chart", 10, 10 );

 
DrawLevels( MinYrProfit, MaxYrProfit ); 
}

function 
DisplayMonthlyProfits()
{
 
Bar = 0;
 
 
MinAvgProf = MaxAvgProf = 0;
 for( 
y = 1; y <= 12; y++ )
 {
   
Chg = VarGet("SumChgMon" + y ) / VarGet("SumMon" + y );
   
MinAvgProf = Min( MinAvgProf, Chg );
   
MaxAvgProf = Max( MaxAvgProf, Chg );
 }

 for( 
y = 1; y <= 12; y++ )
 {
   
Chg = VarGet("SumChgMon" + y ) / VarGet("SumMon" + y );
   
DrawBar( StrExtract(MonthNames, y-1 ), Bar++, 13, Chg, MinAvgProf , MaxAvgProf );
 }
 
GfxTextOut("Avg. Monthly % Profit chart", 10, 10 );

 
DrawLevels( MinAvgProf , MaxAvgProf ); 
}

///////////////////////////
// This function checks if currently selected symbol
// is portfolio equity
//////////////////////////
function CheckSymbol()
{
 if( 
Name() != "~~~EQUITY" )
 {
  
GfxSelectFont( "Tahoma", 20 ); 
  
GfxSetBkMode( 2 );
  
GfxTextOut("For accurate results switch to ~~~EQUITY symbol", 10, 10 );
 }
}

////////////////////////////
// Main program - chart type switch
////////////////////////////
type = ParamList("Chart Type", "Profit Table|Yearly Profits|Avg. Monthly Profits", 0 );

switch( 
type )
{
 case 
"Profit Table": 
         
DisplayProfitTable();  
         break;
 case 
"Yearly Profits": 
         
DisplayYearlyProfits();
         break;
 case 
"Avg. Monthly Profits": 
         
DisplayMonthlyProfits();
         break;
}

CheckSymbol()

Figure 1. Profit chart in table mode

Profit chart example 2

Figure 2. Profit chart in yearly mode

Profit chart example 3

Figure 3. Profit chart in monthly mode

Profit chart example 4