
August 29, 2015
How to add symbol labels to Relative Performance chart
The built-in Relative Performance chart displays symbol names colored respectively in the chart Title. However – it may be practical to display the symbol label next to the plotted line for easier identification. This can easily be done with PlotText or PlotTextSetFont function.
A sample code showing such modification is presented below. Font size of the labels can be changed through Parameters dialog.
_N( TickerList = ParamStr( "Tickers", "^DJI,MSFT,GE" ) );
fontsize = Param("Label font size", 10, 4, 30, 1 );
fvb = Status( "firstvisiblebar" );

for( i = 0; ( symbol = StrExtract( Name() + "," + TickerList, i ) ) != ""; i++ )
{
    fc = Foreign( symbol, "C" );

    if( ! IsNull( fc[ 0 ] ) )
    {
        relP = 100 * ( fc - fc[ fvb ] ) / fc[ fvb ];
        Plot( relP , symbol, color = colorLightOrange + ( ( 2 * i ) % 15 ), styleLine );

        x = LastValue( BarIndex() ) + 1;
        y = LastValue( relP );

        PlotTextSetFont( symbol, "Arial", fontsize, x, y, GetChartBkColor(), color, -fontsize/2 );
    }
}

PlotGrid( 0, colorYellow );
_N( Title = "{{NAME}} - Relative Performance [%]: {{VALUES}}" )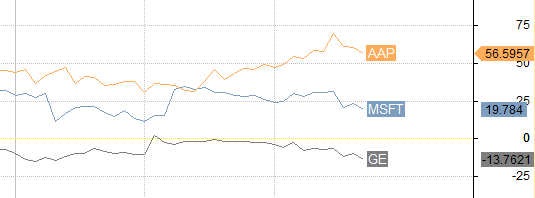
 Filed by Tomasz Janeczko at 4:35 pm under Charting
Comments Off on How to add symbol labels to Relative Performance chart