
September 30, 2015
Positioning area plots behind the grid lines
When we want to paint the background with custom colors to indicate certain states or conditions – we can use area plots style for this purpose. The code example presented below shows green background when Close stays above 50-period moving average and red when below MA-50.
Plot( Close, "Close", colorDefault, styleThick);
Plot( MA50 = MA(Close,50), "MA50", colorBlue, styleThick);

color = IIf( Close > MA50, colorGreen, colorRed );
Plot( 1, "", color, styleArea|styleOwnScale,0,1 )
However – by default both grid lines and the selector line would get covered by the area plot:
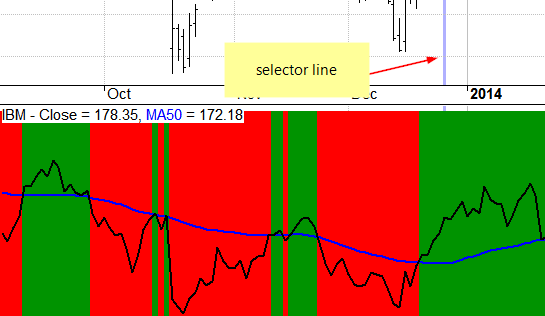
There is an easy fix for that – AmiBroker allows to specify the Z-axis position too, so we can shift the visibility and order of plots (including their position against grids and other elements) by means of Z-order argument of Plot function.
If we specify the Z-order argument to -1 that means we move the particular plot one level behind and this would also be located below the grids.
Plot( Close, "Close", colorDefault, styleThick);
Plot( MA50 = MA(Close,50), "MA50", colorBlue, styleThick);

color = IIf( Close > MA50, colorGreen, colorRed );
Plot( 1, "", color, styleArea|styleOwnScale,0,1,0,-1 ); // the 8th argument specifies z-orde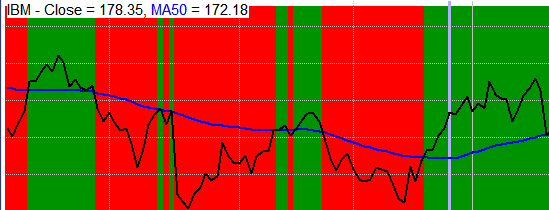
More information about use of Z-order can be found in the User’s Guide:
http://www.amibroker.com/guide/h_indbuilder2.html
 Filed by Tomasz Janeczko at 10:23 am under Indicators
Comments Off on Positioning area plots behind the grid lines